Exploring mobile eye tracking Data: A Demo Dataset Walkthrough
Research Digest
July 14, 2022
This is part 2 of a guide. If you're new here you might want to head over to part 1.
What will I learn here?
This blog post is an introduction into analyzing Areas of Interest (AOIs) with Pupil Invisible and Reference Image Mapper. It comes with downloadable jupyter notebooks to code along with our examples - all based on our new Demo Workspace.
We'll show you how to define AOIs in reference images, both when there are multiple AOIs within one reference image, and when they are distributed across them.
From there, we will compute three different metrics: Hit rates, time to first contact, and dwell time. The notebooks demonstrate how to load and display reference images and fixation data, as well as how to make summaries of AOI data and plot the results.
This toolkit is intended to be your playground to learn, experiment and gain confidence in handling your data before you tackle your own research questions.
Getting stuck with anything? Head over to our Discord community and ask your question in the pupil-invisible channel.
Using Areas of Interest to gain insight into visual exploration
In our last blog post using the example of a mock-up study in an art gallery, we showed you how we collect, enrich and visualize eye tracking data in Pupil Cloud. Working in Cloud, you can see where each wearer's gaze went, and get an intuitive grasp of the distribution of gaze with heatmaps.
But as researchers we ultimately need numbers to quantify and report the effects in our data. Mostly, we will want to answer questions like “Where did people look most often?”, “When did people look at a specific region?”, and “How long did people look at one specific region?”.
To find the answers to these questions, we will work with Areas of Interest (AOIs). Simply put, AOIs are the parts of the world that you as a researcher are interested in. In the case of our demo study in an Art Gallery, each painting might be one Area of Interest. For now, Pupil Cloud does not provide you with a graphical interface to mark AOIs and analyze how they were explored. Which means if you want to get all the way down to the where, when and how long, you’ll need to export data from Cloud, and get your hands dirty with coding.
So from here on, it’s just you, with a bunch of files and your computer. Just you? Not quite, one little blogpost is here to help you, along with 4 notebooks containing step-by-step code examples. Each section in this blog post comes with a notebook containing code examples. If you are here for some hands-on exercises, download the notebooks, the corresponding data from our Demo Workspace, and start playing! The blog post gives you a high level idea of what is going on, and points to some common problems. The notebooks are the technical backbone that will help you understand how things are done.
Hi there - ready to dive in?
The Download
Downloadable jupyter notebooks to code.
Getting the gaze data from Pupil Cloud is as easy as right-clicking on the Reference Image Mapper Enrichment and clicking “Download”. If you don’t know what the Reference Image Mapper Enrichment is, check out the last blog post, or the documentation.
The download will be a zipped folder that contains different files: some information about the enrichment, csv files with fixations, gaze positions, and recording sections. You will also find a .jpeg file here - your actual reference image.
Want to see this for yourself? Head to our Demo Workspace and download any Reference Image Mapper Enrichment.
Explore
When you want to know what data you’re dealing with, it always makes sense to visualize it first. In the first notebook, we do exactly this. We visualize the reference image, and plot fixation data on top. With some plotting skills, we can scale the size of each fixation marker such that it’s proportional to the duration of each fixation.
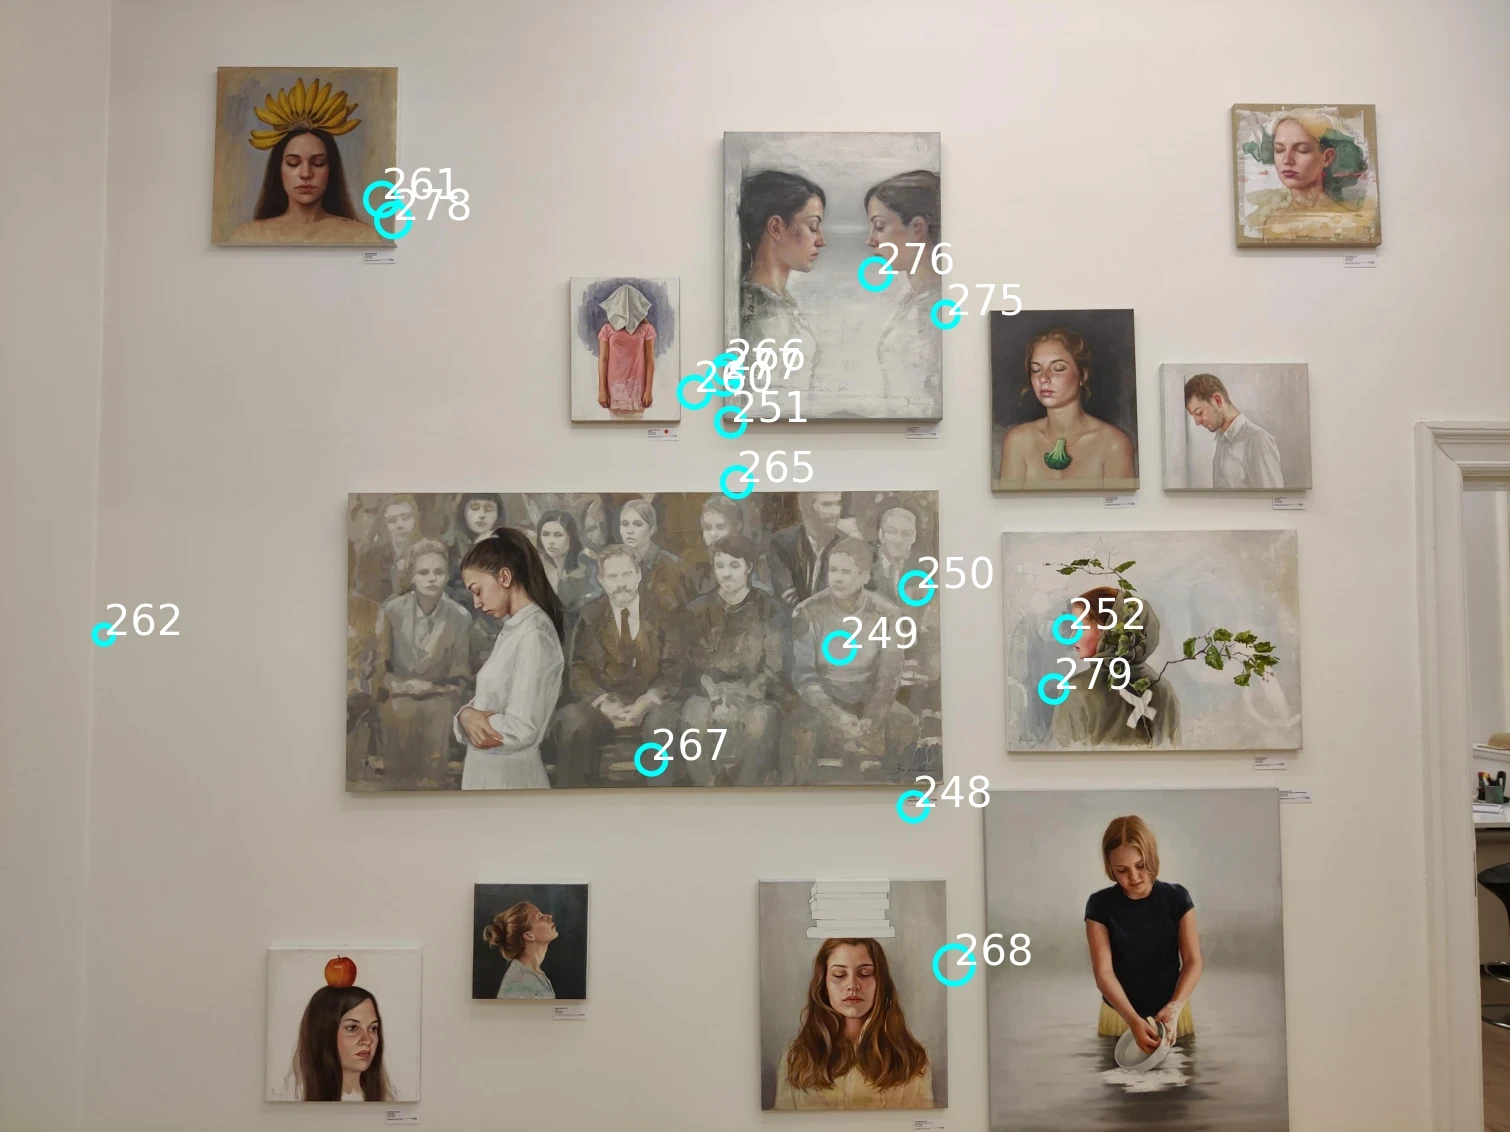
Fixations on a single reference image, for one visitor to an art gallery.
Inspecting the data like this is important - it gives you a rough idea how the data looks, and it can already indicate potential problems.
Defining Areas of Interest
Defining your AOIs is the most crucial step. Which features will go into your analysis, and which will be left out, depends on it. So take a moment to think about this step.
Where are your AOIs in space?
One particularity of mobile eye tracking is that people can move, and can visit AOIs that are potentially far away from each other. In an art gallery, there may be walls with several paintings close to each other. Also, there can be walls with only one painting. And for sure, there are many different walls over the entire gallery.
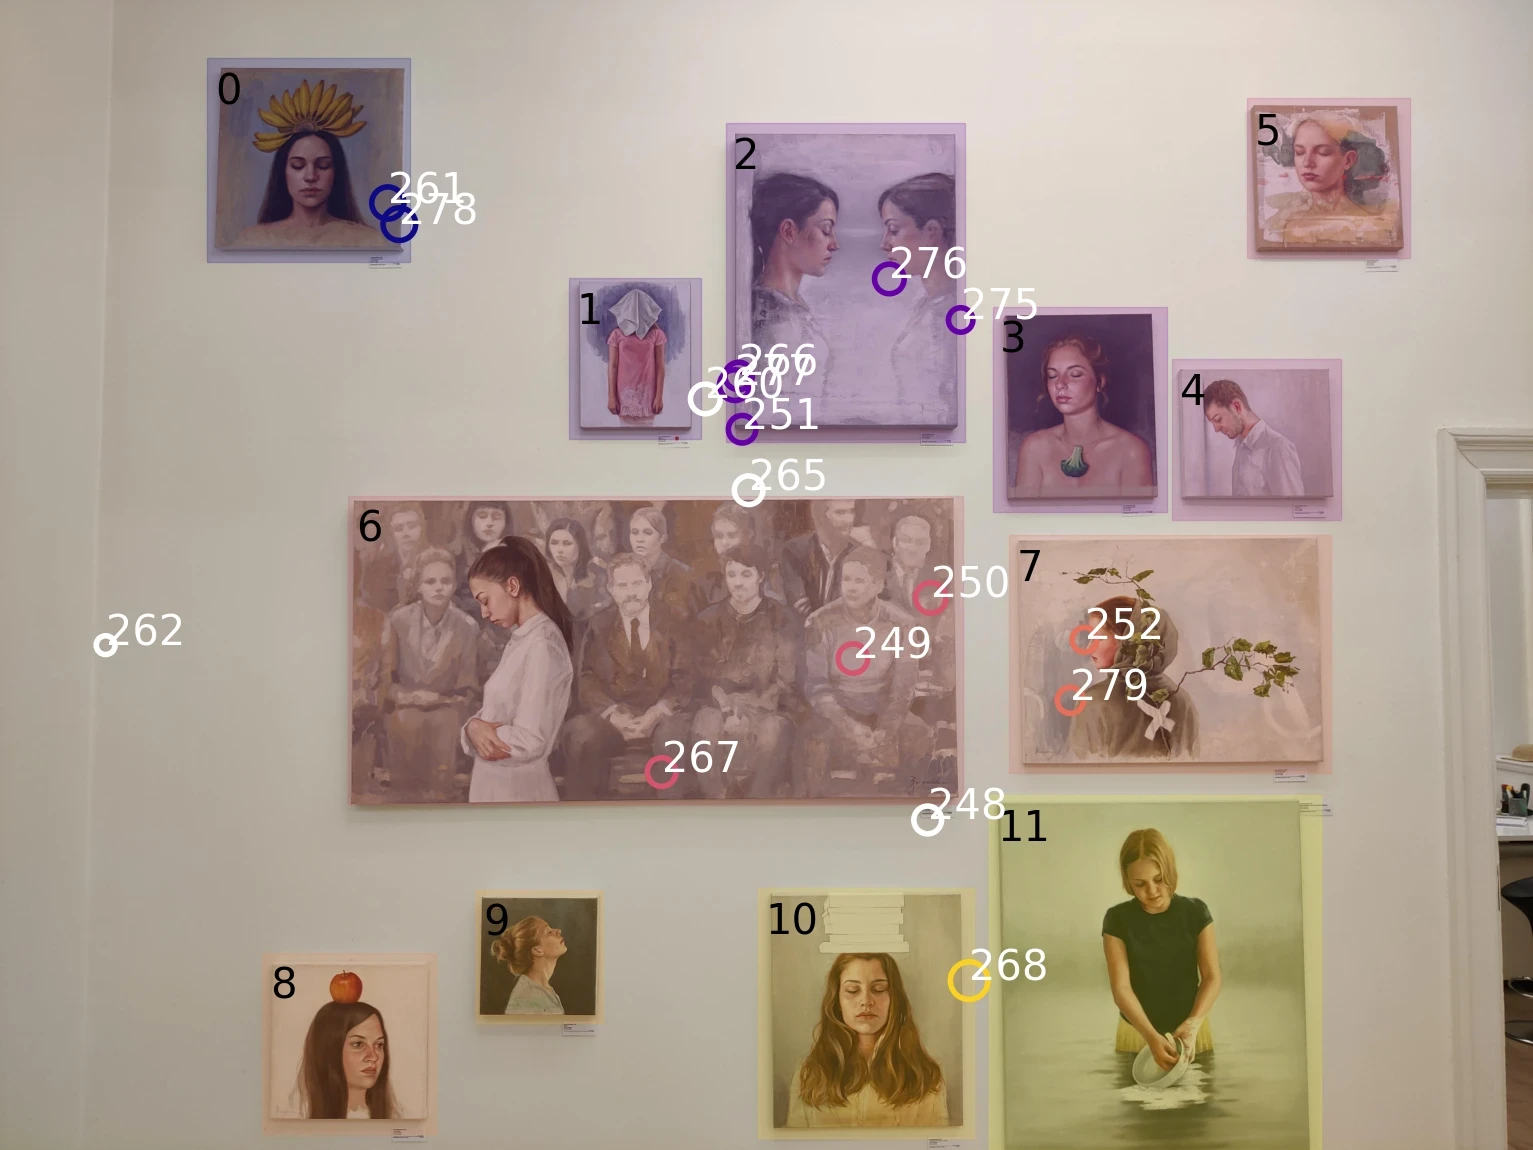
If the AOIs are close to each other, you can capture all of them in one reference image. We will call these “nested AOIs”, as they are nested in one reference image. In our gallery example, we instructed observers to stand in front of the image to create a stable viewing situation for nested AOIs.
If the AOIs are far apart, each AOI needs its own reference image. We will refer to that case as “distributed AOIs”. In the gallery example, this case is best reflected in the walking condition: We asked observers to walk around freely, thus creating a dynamic situation with AOIs spread out over the entire exhibition.
Let’s look at this difference in action!
Defining nested AOIs
Jupyter notebook example
An easy way to mark AOIs on an image is with the opencv library. The selectROIs function opens a window where you can draw rectangular Areas of Interest on your reference image.
As soon as all AOIs are defined, we can loop over all fixations and check if they were inside any of the AOIs. What we get in this step is a critical bit of extra information:
On which (if any) Area of Interest did every single fixation occur?After marking Areas of Interest, we can visualize them on top of our reference image, and mark all fixations inside them. Here is an example from one single observer:

Nested AOIs and fixations on a reference image for one observer. Colours correspond to the AOI fixated.
Defining distributed AOIs
Using multiple reference images makes our lives easier when defining AOIs. The Reference Image Mapper comes with a tag defining if a fixation was on the reference image or not. We can use these tags to map each fixation to the AOI/reference image.
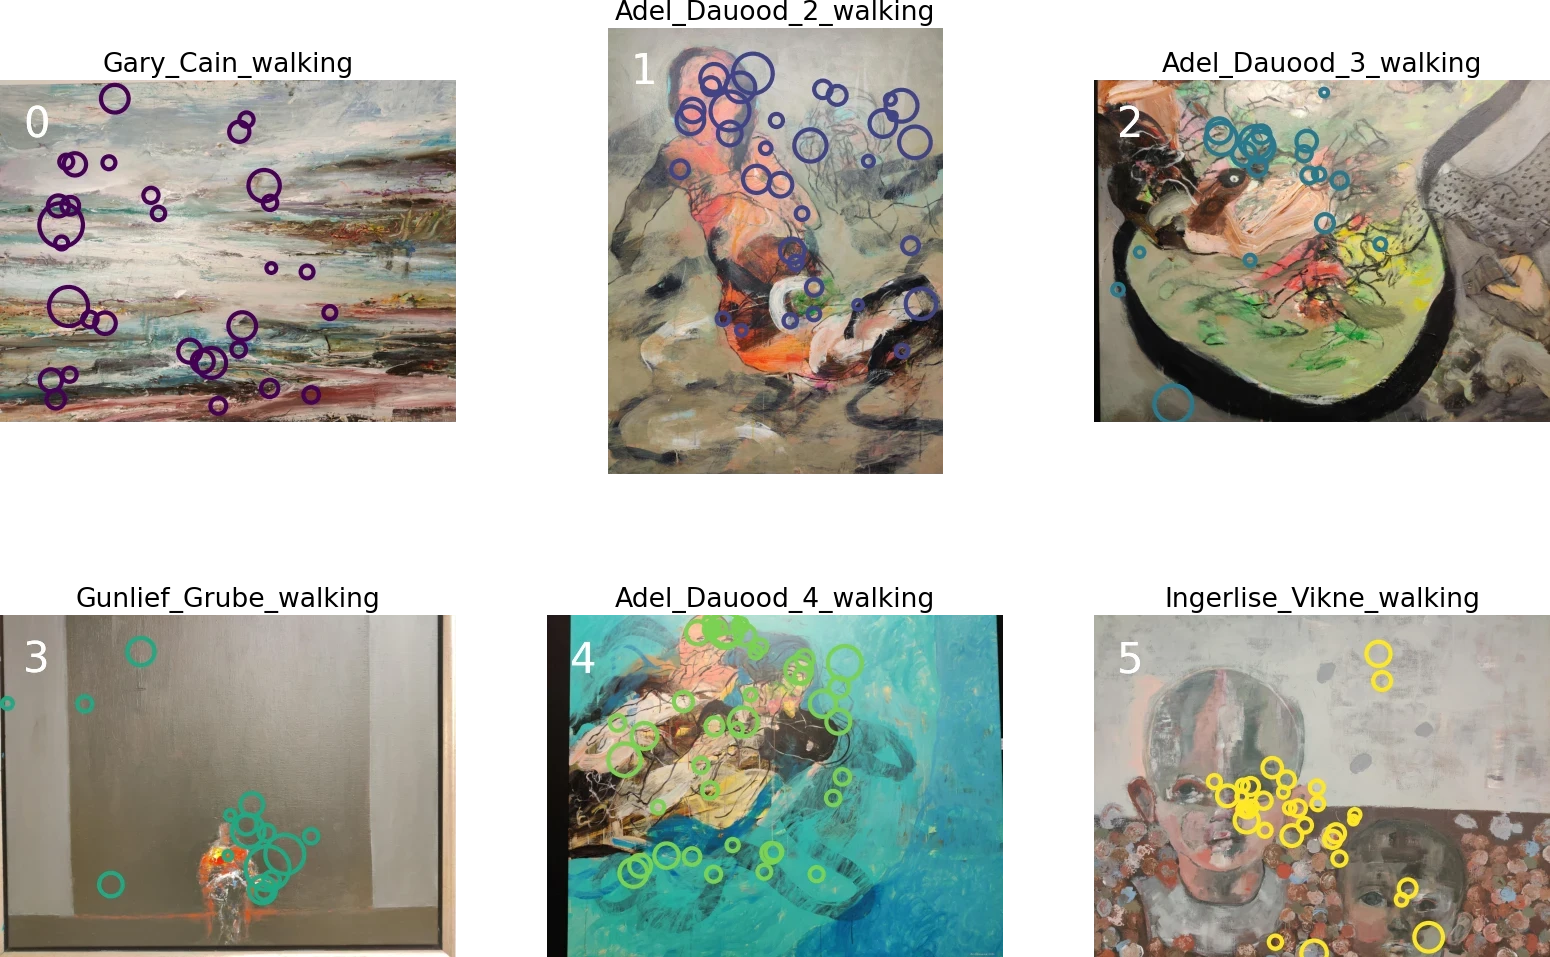
Fixations on distributed reference images. Colours correspond to the AOI fixated.
The special thing when having one reference image per AOI is that every reference image now lives in its own coordinate system. That means you’ve lost the spatial information between them, and it’s going to be harder to define the size of each AOI from the reference image.A good solution for the last problem is to note the size of the real world AOI in a template while making the recording. We didn’t do that for these recordings, which highlights the importance of piloting!
Pro Tip: Sometimes, you might be interested in sub-regions of distributed AOIs. In this example, you might wonder how often observers looked at faces in each painting. You can define sub-regions as nested AOIs - there is no difference in the workflow! Try it yourself by loading the Reference Image Mapper for the painting by Ingerlise_Vikne_walking into the notebook for nested AOIs. You’ll see, it’s easy to reproduce the image below.
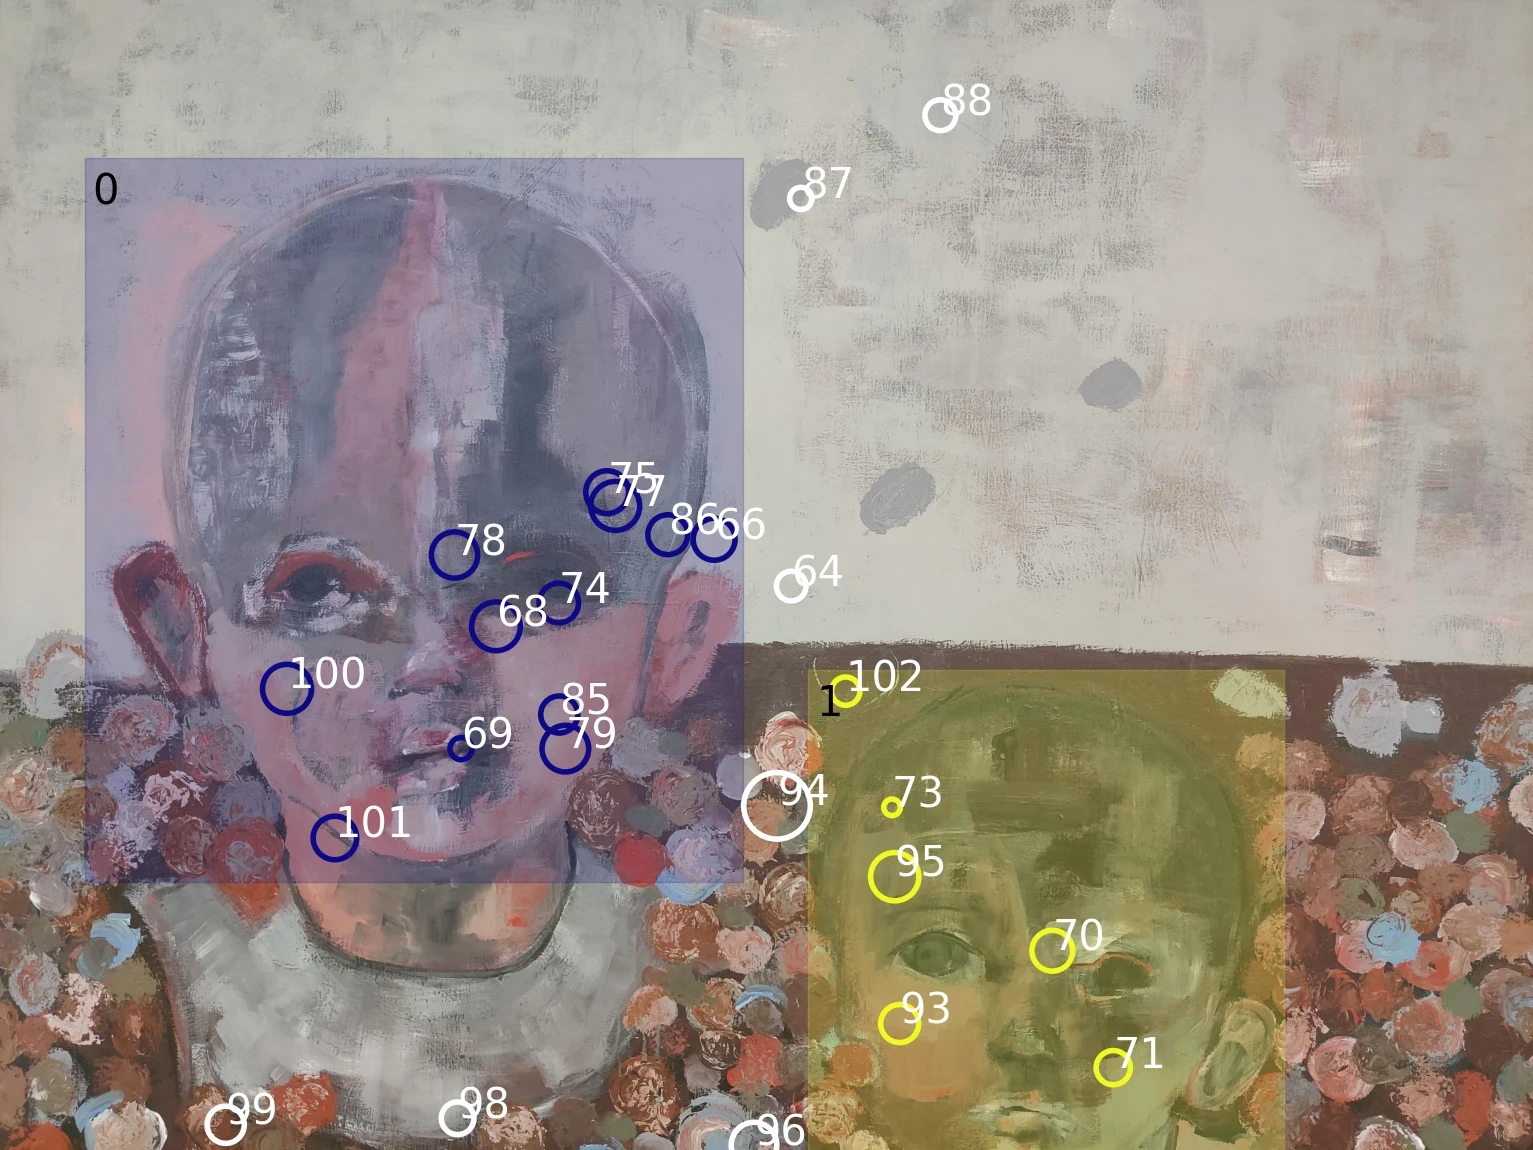
Nested AOI fixations on Ingerlise Vikne painting.
Quantifying visual exploration
Now that all AOIs are defined, and all fixations inside them are labeled, you can finally do some number crunching. You can use the same code for both nested and distributed AOIs, but be aware: how to interpret your findings might differ between the two cases.
Where did most people look?
The metric we compute here is the hit rate. We count how many participants looked at each AOI (1 participant = 1 hit), and compute the percentage of participants whose gaze “hit” the AOI. In our case (there are 5 people in our dataset), a hit rate of 20% means one person looked at the AOI. For example, this is the case with AOI 1 in the nested data.
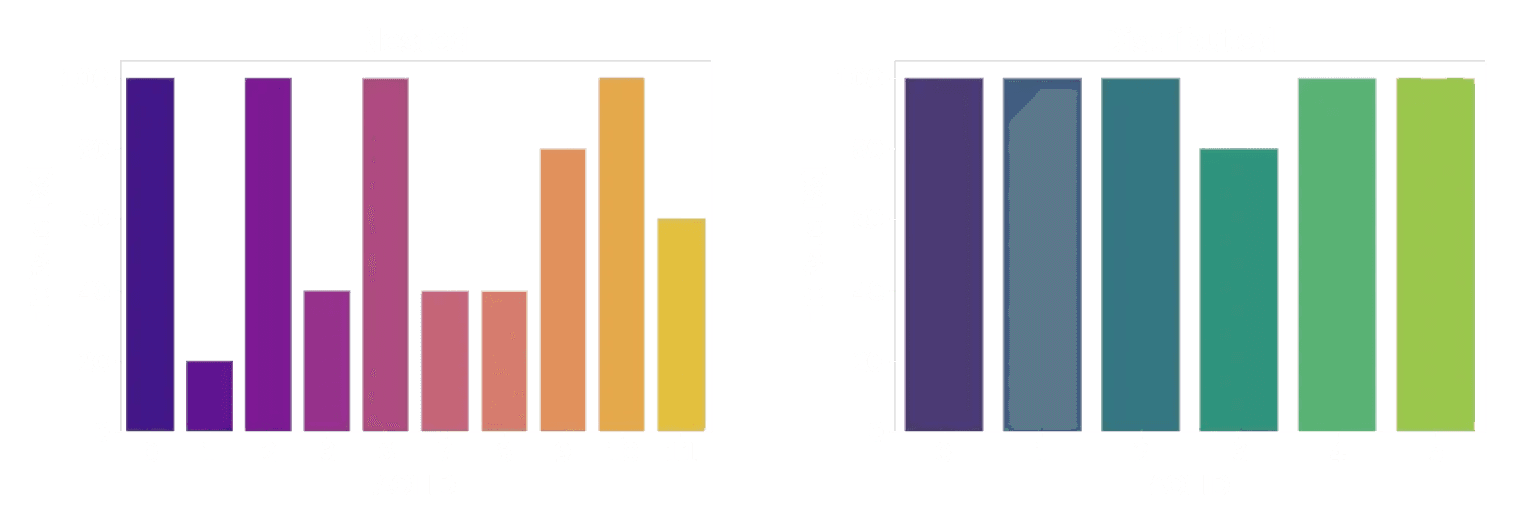
Hit Rate - Nested; Hit Rate - Distributed
Comparing hit rates between nested and distributed AOIs, we note that while the distributed AOIs (right) were all (but one) looked at by each participant, this is not true for the nested AOIs (left). Look again at the reference picture of the nested AOIs and the plot here. You might notice that there seems to be a correlation between the size of an AOI and the hit rate (2, 6, and 10 are large paintings, and were looked at by everyone). This might be exactly what you are looking for. But it can also be a confounding factor.
When did people look at an AOI?
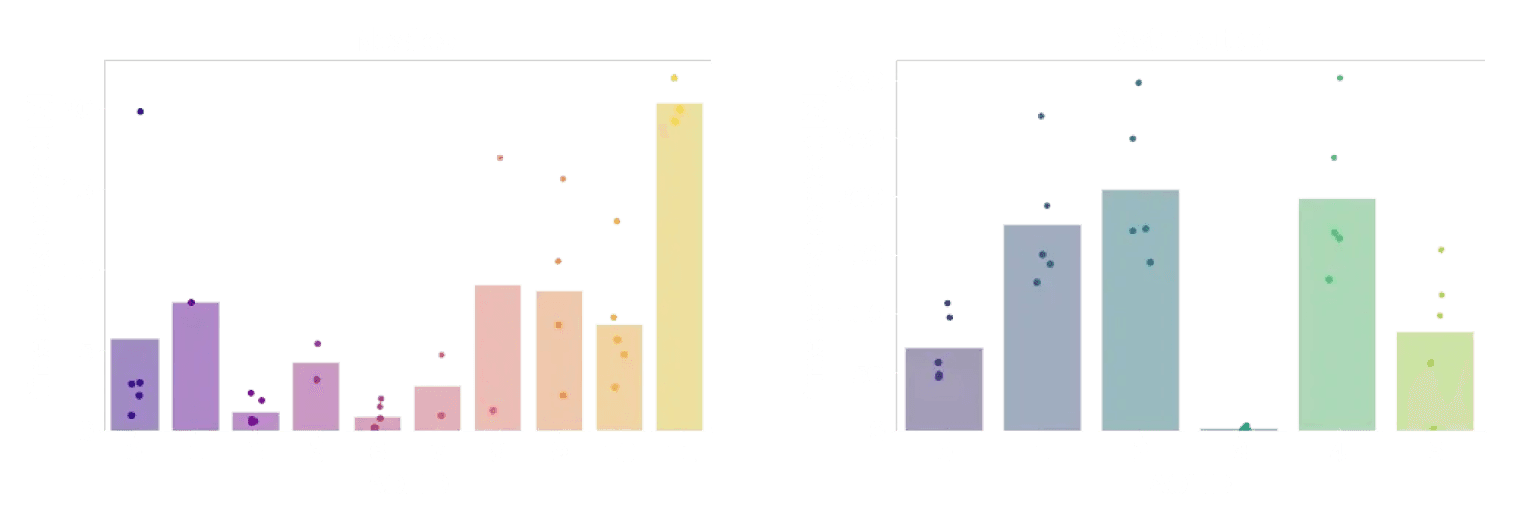
Time to First Contact - Nested; Time to First Contact - Distributed
Another interesting question is how quickly an observer’s gaze fell onto each AOI. Did they need to search before they found it? Did it immediately grab their attention? To answer this question, we use time to first contact. This is just going to be the difference between when your recording started and when the first fixation was identified on the image.
We can again do this for both nested and distributed AOIs. But wait a second - with distributed AOIs, we have a somewhat odd situation. In a gallery, the first thing that’s being looked at is probably what the curator put near the start of the exhibition! So the temporal order in which distributed AOIs were looked at can be confused with the spatial order in which they were placed.
In the plots above, it’s also visible that the time to first contact is longer on the distributed AOIs. Makes sense, right? Walking around will take longer than just moving your eyes around.
One way to avoid these points affecting your interpretation of the data could be to add an event in Pupil Cloud where the distributed AOIs first came into view in the scene video, even if they were not looked at straight away. That way you can use the difference between the new event and when the first fixation was identified on the image. This makes it a fairer comparison to the nested case.
How long did people look at an AOI?
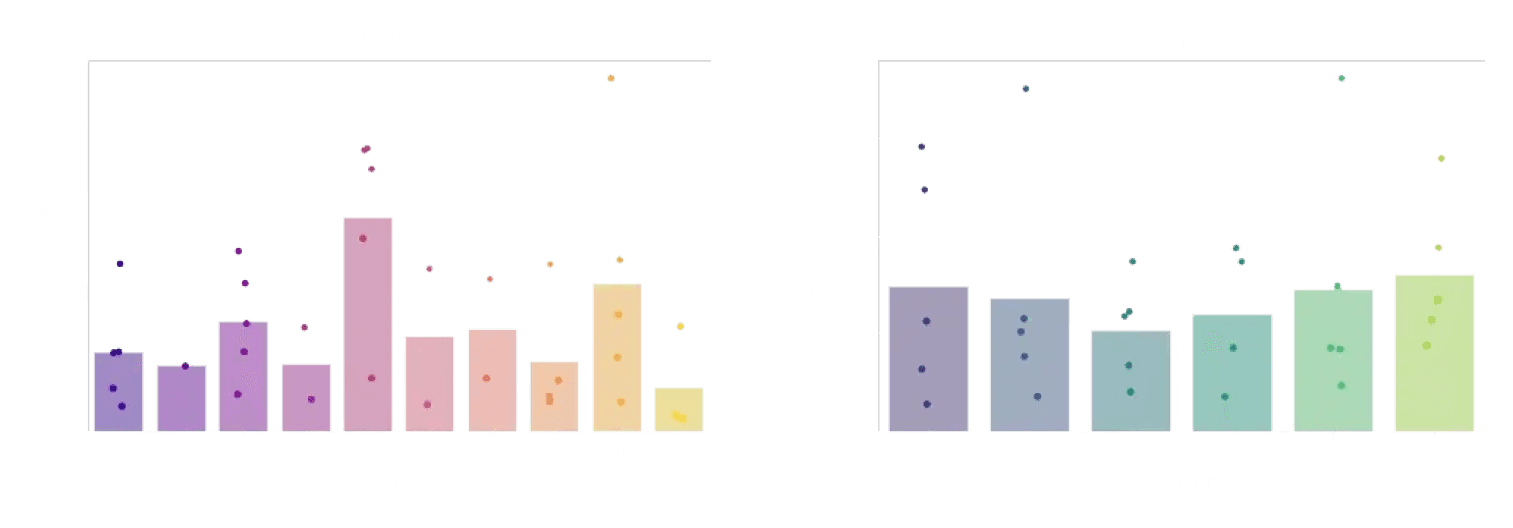
Dwell Time - Nested; Dwell Time - Distributed
Finally, once people have looked at an AOI - how long will they stay there with their eyes? For this, we want a measure called dwell time. Dwell time is what we get if we sum up the duration of all fixations on a single AOI.
As for the time to first contact, total dwell times are longer on distributed than on nested AOIs. One way to interpret this is that people spent more time looking at an isolated painting than at a painting that was surrounded by many others. Or, because the individual paintings were larger than the ones in the nested setup, people spent more time looking at them.
So many questions to answer!
If there are now even more questions about how visitors inspected the paintings in this example study - great! Because now is the time for you to get creative and apply what you have learned to your own questions. The data in our Demo Workspace has a lot of features that might be comparable to your own study - multiple conditions, multiple wearers, and many, many potential Areas of Interest.
If you don't know where to start, here are some challenges to inspire you:
Which of the two paintings in “Linda Horn x2” was more often looked at?
Which painting by Adel Dauood was looked at the longest?
Can you reconstruct which distributed paintings were in the same room based on their time to first contact?
Share your answers and ask your questions in Discord!
This is part 2 of a guide. If you're new here you might want to head over to part 1.
What will I learn here?
This blog post is an introduction into analyzing Areas of Interest (AOIs) with Pupil Invisible and Reference Image Mapper. It comes with downloadable jupyter notebooks to code along with our examples - all based on our new Demo Workspace.
We'll show you how to define AOIs in reference images, both when there are multiple AOIs within one reference image, and when they are distributed across them.
From there, we will compute three different metrics: Hit rates, time to first contact, and dwell time. The notebooks demonstrate how to load and display reference images and fixation data, as well as how to make summaries of AOI data and plot the results.
This toolkit is intended to be your playground to learn, experiment and gain confidence in handling your data before you tackle your own research questions.
Getting stuck with anything? Head over to our Discord community and ask your question in the pupil-invisible channel.
Using Areas of Interest to gain insight into visual exploration
In our last blog post using the example of a mock-up study in an art gallery, we showed you how we collect, enrich and visualize eye tracking data in Pupil Cloud. Working in Cloud, you can see where each wearer's gaze went, and get an intuitive grasp of the distribution of gaze with heatmaps.
But as researchers we ultimately need numbers to quantify and report the effects in our data. Mostly, we will want to answer questions like “Where did people look most often?”, “When did people look at a specific region?”, and “How long did people look at one specific region?”.
To find the answers to these questions, we will work with Areas of Interest (AOIs). Simply put, AOIs are the parts of the world that you as a researcher are interested in. In the case of our demo study in an Art Gallery, each painting might be one Area of Interest. For now, Pupil Cloud does not provide you with a graphical interface to mark AOIs and analyze how they were explored. Which means if you want to get all the way down to the where, when and how long, you’ll need to export data from Cloud, and get your hands dirty with coding.
So from here on, it’s just you, with a bunch of files and your computer. Just you? Not quite, one little blogpost is here to help you, along with 4 notebooks containing step-by-step code examples. Each section in this blog post comes with a notebook containing code examples. If you are here for some hands-on exercises, download the notebooks, the corresponding data from our Demo Workspace, and start playing! The blog post gives you a high level idea of what is going on, and points to some common problems. The notebooks are the technical backbone that will help you understand how things are done.
Hi there - ready to dive in?
The Download
Downloadable jupyter notebooks to code.
Getting the gaze data from Pupil Cloud is as easy as right-clicking on the Reference Image Mapper Enrichment and clicking “Download”. If you don’t know what the Reference Image Mapper Enrichment is, check out the last blog post, or the documentation.
The download will be a zipped folder that contains different files: some information about the enrichment, csv files with fixations, gaze positions, and recording sections. You will also find a .jpeg file here - your actual reference image.
Want to see this for yourself? Head to our Demo Workspace and download any Reference Image Mapper Enrichment.
Explore
When you want to know what data you’re dealing with, it always makes sense to visualize it first. In the first notebook, we do exactly this. We visualize the reference image, and plot fixation data on top. With some plotting skills, we can scale the size of each fixation marker such that it’s proportional to the duration of each fixation.

Fixations on a single reference image, for one visitor to an art gallery.
Inspecting the data like this is important - it gives you a rough idea how the data looks, and it can already indicate potential problems.
Defining Areas of Interest
Defining your AOIs is the most crucial step. Which features will go into your analysis, and which will be left out, depends on it. So take a moment to think about this step.
Where are your AOIs in space?
One particularity of mobile eye tracking is that people can move, and can visit AOIs that are potentially far away from each other. In an art gallery, there may be walls with several paintings close to each other. Also, there can be walls with only one painting. And for sure, there are many different walls over the entire gallery.
If the AOIs are close to each other, you can capture all of them in one reference image. We will call these “nested AOIs”, as they are nested in one reference image. In our gallery example, we instructed observers to stand in front of the image to create a stable viewing situation for nested AOIs.
If the AOIs are far apart, each AOI needs its own reference image. We will refer to that case as “distributed AOIs”. In the gallery example, this case is best reflected in the walking condition: We asked observers to walk around freely, thus creating a dynamic situation with AOIs spread out over the entire exhibition.
Let’s look at this difference in action!
Defining nested AOIs
Jupyter notebook example
An easy way to mark AOIs on an image is with the opencv library. The selectROIs function opens a window where you can draw rectangular Areas of Interest on your reference image.
As soon as all AOIs are defined, we can loop over all fixations and check if they were inside any of the AOIs. What we get in this step is a critical bit of extra information:
On which (if any) Area of Interest did every single fixation occur?After marking Areas of Interest, we can visualize them on top of our reference image, and mark all fixations inside them. Here is an example from one single observer:

Nested AOIs and fixations on a reference image for one observer. Colours correspond to the AOI fixated.
Defining distributed AOIs
Using multiple reference images makes our lives easier when defining AOIs. The Reference Image Mapper comes with a tag defining if a fixation was on the reference image or not. We can use these tags to map each fixation to the AOI/reference image.

Fixations on distributed reference images. Colours correspond to the AOI fixated.
The special thing when having one reference image per AOI is that every reference image now lives in its own coordinate system. That means you’ve lost the spatial information between them, and it’s going to be harder to define the size of each AOI from the reference image.A good solution for the last problem is to note the size of the real world AOI in a template while making the recording. We didn’t do that for these recordings, which highlights the importance of piloting!
Pro Tip: Sometimes, you might be interested in sub-regions of distributed AOIs. In this example, you might wonder how often observers looked at faces in each painting. You can define sub-regions as nested AOIs - there is no difference in the workflow! Try it yourself by loading the Reference Image Mapper for the painting by Ingerlise_Vikne_walking into the notebook for nested AOIs. You’ll see, it’s easy to reproduce the image below.

Nested AOI fixations on Ingerlise Vikne painting.
Quantifying visual exploration
Now that all AOIs are defined, and all fixations inside them are labeled, you can finally do some number crunching. You can use the same code for both nested and distributed AOIs, but be aware: how to interpret your findings might differ between the two cases.
Where did most people look?
The metric we compute here is the hit rate. We count how many participants looked at each AOI (1 participant = 1 hit), and compute the percentage of participants whose gaze “hit” the AOI. In our case (there are 5 people in our dataset), a hit rate of 20% means one person looked at the AOI. For example, this is the case with AOI 1 in the nested data.

Hit Rate - Nested; Hit Rate - Distributed
Comparing hit rates between nested and distributed AOIs, we note that while the distributed AOIs (right) were all (but one) looked at by each participant, this is not true for the nested AOIs (left). Look again at the reference picture of the nested AOIs and the plot here. You might notice that there seems to be a correlation between the size of an AOI and the hit rate (2, 6, and 10 are large paintings, and were looked at by everyone). This might be exactly what you are looking for. But it can also be a confounding factor.
When did people look at an AOI?

Time to First Contact - Nested; Time to First Contact - Distributed
Another interesting question is how quickly an observer’s gaze fell onto each AOI. Did they need to search before they found it? Did it immediately grab their attention? To answer this question, we use time to first contact. This is just going to be the difference between when your recording started and when the first fixation was identified on the image.
We can again do this for both nested and distributed AOIs. But wait a second - with distributed AOIs, we have a somewhat odd situation. In a gallery, the first thing that’s being looked at is probably what the curator put near the start of the exhibition! So the temporal order in which distributed AOIs were looked at can be confused with the spatial order in which they were placed.
In the plots above, it’s also visible that the time to first contact is longer on the distributed AOIs. Makes sense, right? Walking around will take longer than just moving your eyes around.
One way to avoid these points affecting your interpretation of the data could be to add an event in Pupil Cloud where the distributed AOIs first came into view in the scene video, even if they were not looked at straight away. That way you can use the difference between the new event and when the first fixation was identified on the image. This makes it a fairer comparison to the nested case.
How long did people look at an AOI?

Dwell Time - Nested; Dwell Time - Distributed
Finally, once people have looked at an AOI - how long will they stay there with their eyes? For this, we want a measure called dwell time. Dwell time is what we get if we sum up the duration of all fixations on a single AOI.
As for the time to first contact, total dwell times are longer on distributed than on nested AOIs. One way to interpret this is that people spent more time looking at an isolated painting than at a painting that was surrounded by many others. Or, because the individual paintings were larger than the ones in the nested setup, people spent more time looking at them.
So many questions to answer!
If there are now even more questions about how visitors inspected the paintings in this example study - great! Because now is the time for you to get creative and apply what you have learned to your own questions. The data in our Demo Workspace has a lot of features that might be comparable to your own study - multiple conditions, multiple wearers, and many, many potential Areas of Interest.
If you don't know where to start, here are some challenges to inspire you:
Which of the two paintings in “Linda Horn x2” was more often looked at?
Which painting by Adel Dauood was looked at the longest?
Can you reconstruct which distributed paintings were in the same room based on their time to first contact?
Share your answers and ask your questions in Discord!
This is part 2 of a guide. If you're new here you might want to head over to part 1.
What will I learn here?
This blog post is an introduction into analyzing Areas of Interest (AOIs) with Pupil Invisible and Reference Image Mapper. It comes with downloadable jupyter notebooks to code along with our examples - all based on our new Demo Workspace.
We'll show you how to define AOIs in reference images, both when there are multiple AOIs within one reference image, and when they are distributed across them.
From there, we will compute three different metrics: Hit rates, time to first contact, and dwell time. The notebooks demonstrate how to load and display reference images and fixation data, as well as how to make summaries of AOI data and plot the results.
This toolkit is intended to be your playground to learn, experiment and gain confidence in handling your data before you tackle your own research questions.
Getting stuck with anything? Head over to our Discord community and ask your question in the pupil-invisible channel.
Using Areas of Interest to gain insight into visual exploration
In our last blog post using the example of a mock-up study in an art gallery, we showed you how we collect, enrich and visualize eye tracking data in Pupil Cloud. Working in Cloud, you can see where each wearer's gaze went, and get an intuitive grasp of the distribution of gaze with heatmaps.
But as researchers we ultimately need numbers to quantify and report the effects in our data. Mostly, we will want to answer questions like “Where did people look most often?”, “When did people look at a specific region?”, and “How long did people look at one specific region?”.
To find the answers to these questions, we will work with Areas of Interest (AOIs). Simply put, AOIs are the parts of the world that you as a researcher are interested in. In the case of our demo study in an Art Gallery, each painting might be one Area of Interest. For now, Pupil Cloud does not provide you with a graphical interface to mark AOIs and analyze how they were explored. Which means if you want to get all the way down to the where, when and how long, you’ll need to export data from Cloud, and get your hands dirty with coding.
So from here on, it’s just you, with a bunch of files and your computer. Just you? Not quite, one little blogpost is here to help you, along with 4 notebooks containing step-by-step code examples. Each section in this blog post comes with a notebook containing code examples. If you are here for some hands-on exercises, download the notebooks, the corresponding data from our Demo Workspace, and start playing! The blog post gives you a high level idea of what is going on, and points to some common problems. The notebooks are the technical backbone that will help you understand how things are done.
Hi there - ready to dive in?
The Download
Downloadable jupyter notebooks to code.
Getting the gaze data from Pupil Cloud is as easy as right-clicking on the Reference Image Mapper Enrichment and clicking “Download”. If you don’t know what the Reference Image Mapper Enrichment is, check out the last blog post, or the documentation.
The download will be a zipped folder that contains different files: some information about the enrichment, csv files with fixations, gaze positions, and recording sections. You will also find a .jpeg file here - your actual reference image.
Want to see this for yourself? Head to our Demo Workspace and download any Reference Image Mapper Enrichment.
Explore
When you want to know what data you’re dealing with, it always makes sense to visualize it first. In the first notebook, we do exactly this. We visualize the reference image, and plot fixation data on top. With some plotting skills, we can scale the size of each fixation marker such that it’s proportional to the duration of each fixation.

Fixations on a single reference image, for one visitor to an art gallery.
Inspecting the data like this is important - it gives you a rough idea how the data looks, and it can already indicate potential problems.
Defining Areas of Interest
Defining your AOIs is the most crucial step. Which features will go into your analysis, and which will be left out, depends on it. So take a moment to think about this step.
Where are your AOIs in space?
One particularity of mobile eye tracking is that people can move, and can visit AOIs that are potentially far away from each other. In an art gallery, there may be walls with several paintings close to each other. Also, there can be walls with only one painting. And for sure, there are many different walls over the entire gallery.
If the AOIs are close to each other, you can capture all of them in one reference image. We will call these “nested AOIs”, as they are nested in one reference image. In our gallery example, we instructed observers to stand in front of the image to create a stable viewing situation for nested AOIs.
If the AOIs are far apart, each AOI needs its own reference image. We will refer to that case as “distributed AOIs”. In the gallery example, this case is best reflected in the walking condition: We asked observers to walk around freely, thus creating a dynamic situation with AOIs spread out over the entire exhibition.
Let’s look at this difference in action!
Defining nested AOIs
Jupyter notebook example
An easy way to mark AOIs on an image is with the opencv library. The selectROIs function opens a window where you can draw rectangular Areas of Interest on your reference image.
As soon as all AOIs are defined, we can loop over all fixations and check if they were inside any of the AOIs. What we get in this step is a critical bit of extra information:
On which (if any) Area of Interest did every single fixation occur?After marking Areas of Interest, we can visualize them on top of our reference image, and mark all fixations inside them. Here is an example from one single observer:

Nested AOIs and fixations on a reference image for one observer. Colours correspond to the AOI fixated.
Defining distributed AOIs
Using multiple reference images makes our lives easier when defining AOIs. The Reference Image Mapper comes with a tag defining if a fixation was on the reference image or not. We can use these tags to map each fixation to the AOI/reference image.

Fixations on distributed reference images. Colours correspond to the AOI fixated.
The special thing when having one reference image per AOI is that every reference image now lives in its own coordinate system. That means you’ve lost the spatial information between them, and it’s going to be harder to define the size of each AOI from the reference image.A good solution for the last problem is to note the size of the real world AOI in a template while making the recording. We didn’t do that for these recordings, which highlights the importance of piloting!
Pro Tip: Sometimes, you might be interested in sub-regions of distributed AOIs. In this example, you might wonder how often observers looked at faces in each painting. You can define sub-regions as nested AOIs - there is no difference in the workflow! Try it yourself by loading the Reference Image Mapper for the painting by Ingerlise_Vikne_walking into the notebook for nested AOIs. You’ll see, it’s easy to reproduce the image below.

Nested AOI fixations on Ingerlise Vikne painting.
Quantifying visual exploration
Now that all AOIs are defined, and all fixations inside them are labeled, you can finally do some number crunching. You can use the same code for both nested and distributed AOIs, but be aware: how to interpret your findings might differ between the two cases.
Where did most people look?
The metric we compute here is the hit rate. We count how many participants looked at each AOI (1 participant = 1 hit), and compute the percentage of participants whose gaze “hit” the AOI. In our case (there are 5 people in our dataset), a hit rate of 20% means one person looked at the AOI. For example, this is the case with AOI 1 in the nested data.

Hit Rate - Nested; Hit Rate - Distributed
Comparing hit rates between nested and distributed AOIs, we note that while the distributed AOIs (right) were all (but one) looked at by each participant, this is not true for the nested AOIs (left). Look again at the reference picture of the nested AOIs and the plot here. You might notice that there seems to be a correlation between the size of an AOI and the hit rate (2, 6, and 10 are large paintings, and were looked at by everyone). This might be exactly what you are looking for. But it can also be a confounding factor.
When did people look at an AOI?

Time to First Contact - Nested; Time to First Contact - Distributed
Another interesting question is how quickly an observer’s gaze fell onto each AOI. Did they need to search before they found it? Did it immediately grab their attention? To answer this question, we use time to first contact. This is just going to be the difference between when your recording started and when the first fixation was identified on the image.
We can again do this for both nested and distributed AOIs. But wait a second - with distributed AOIs, we have a somewhat odd situation. In a gallery, the first thing that’s being looked at is probably what the curator put near the start of the exhibition! So the temporal order in which distributed AOIs were looked at can be confused with the spatial order in which they were placed.
In the plots above, it’s also visible that the time to first contact is longer on the distributed AOIs. Makes sense, right? Walking around will take longer than just moving your eyes around.
One way to avoid these points affecting your interpretation of the data could be to add an event in Pupil Cloud where the distributed AOIs first came into view in the scene video, even if they were not looked at straight away. That way you can use the difference between the new event and when the first fixation was identified on the image. This makes it a fairer comparison to the nested case.
How long did people look at an AOI?

Dwell Time - Nested; Dwell Time - Distributed
Finally, once people have looked at an AOI - how long will they stay there with their eyes? For this, we want a measure called dwell time. Dwell time is what we get if we sum up the duration of all fixations on a single AOI.
As for the time to first contact, total dwell times are longer on distributed than on nested AOIs. One way to interpret this is that people spent more time looking at an isolated painting than at a painting that was surrounded by many others. Or, because the individual paintings were larger than the ones in the nested setup, people spent more time looking at them.
So many questions to answer!
If there are now even more questions about how visitors inspected the paintings in this example study - great! Because now is the time for you to get creative and apply what you have learned to your own questions. The data in our Demo Workspace has a lot of features that might be comparable to your own study - multiple conditions, multiple wearers, and many, many potential Areas of Interest.
If you don't know where to start, here are some challenges to inspire you:
Which of the two paintings in “Linda Horn x2” was more often looked at?
Which painting by Adel Dauood was looked at the longest?
Can you reconstruct which distributed paintings were in the same room based on their time to first contact?
Share your answers and ask your questions in Discord!