Research Digest
|
Human Factors Engineering
Beyond Telemetry: Decoding the Human Factor in Driving
Automotive & Driving
Transportation & Mobility

For decades, driving performance has been assessed primarily through vehicle metrics such as speed, steering angle, and distance. Yet the largest source of variability on the road comes from the human driver. Drivers must continuously adapt their visual strategies, manage cognitive load, and respond safely to stressful environments. However, these cognitive and physiological processes involved are largely invisible to traditional vehicle sensors.
This digest summarizes four recent studies that utilize Neon wearable eye-tracking, combined with physiological and vehicle telemetry data, to investigate human performance during driving scenarios. The research reveals how drivers adapt to complex maneuvers, changing environmental conditions, and requests for automated system takeovers.
Measuring the Hidden Workload: When Steering Masks Stress
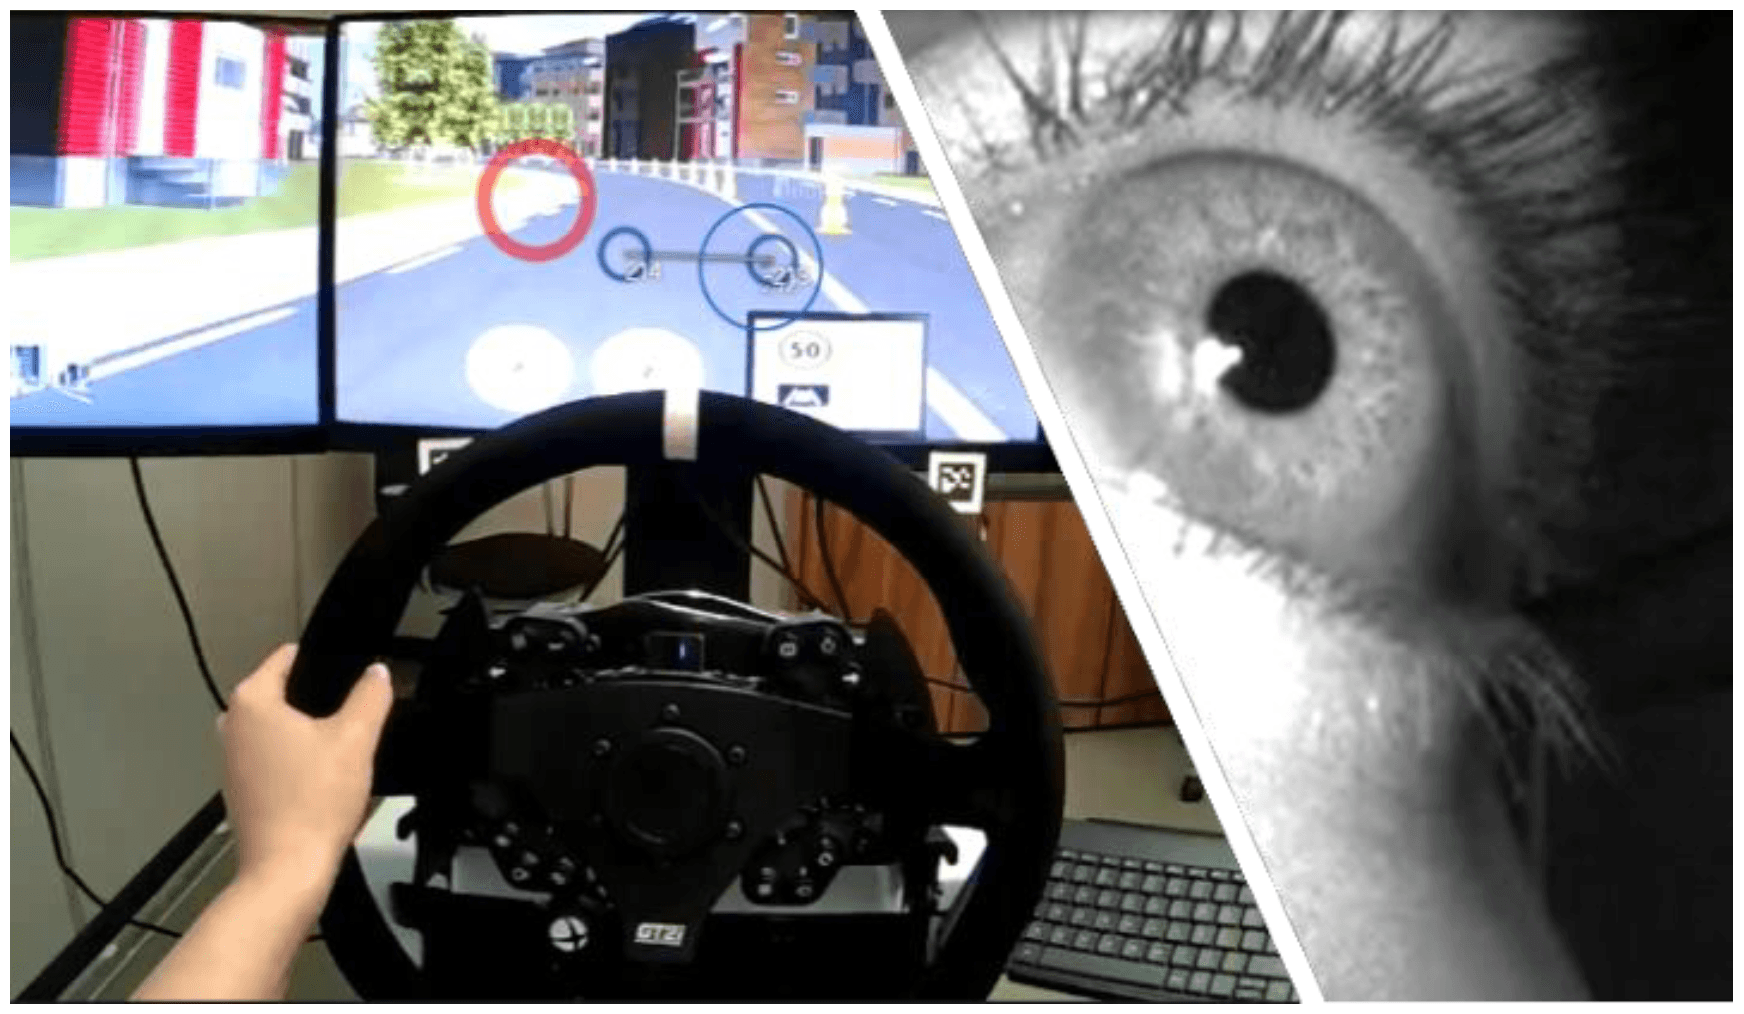
Figure 1: Frame from the scene video of a Neon recording collected from a participant using a driving simulator. Source: Bosurgi, G., Pellegrino, O., Sollazzo, G., & Ruggeri, A. (2024, July). Analysis of a Driver's Visual Behaviour and its Relationship with the Smart Road Context. In 2024 IEEE International Symposium on Measurements & Networking (M&N) (pp. 01-06). IEEE.
One of the greatest challenges in driving analysis is that performance metrics can be misleading. A study from the University of Messina (Italy) highlights that drivers often engage in "compensatory actions" that mask their true stress levels, maintaining vehicle control even while under high cognitive load.
Using Neon in a simulator, Bosurgi et al. measured pupil diameter and blink rate during high-demand maneuvers: overtaking a slow vehicle and navigating a work zone. While the vehicle trajectory often appeared typical, the eye tracking data revealed significant physiological reactions:
Rapid pupil contraction and increased blink frequency occurred during overtaking.
Variations in pupil diameter correlated with lane position, confirming that mental stress affects vehicle control.
Similar responses were seen during forced lane changes in work zones.
The study suggests that analyzing pupillometry and blink rates can serve as a reliable method for identifying stress induced by non-routine road events.
Reading the Road: How Gaze Adapts to Rain
How does visual attention shift when we leave the simulator and enter the real world? In a case study using Neon on actual highways, researchers tracked an experienced driver traversing the same route under both sunny and rainy conditions.
They found that the driver unconsciously altered their visual strategy to cope with reduced visibility:
Longer fixations: Average duration increased from 0.25 s (clear) to 0.53 s (rain), indicating higher cognitive demand.
Gaze shifts: More frequent attention to the dashboard during rain for monitoring vehicle status.
Elevated gaze: Drivers looked further down the road to anticipate hazards.
This demonstrates that visual attention can indeed be a dynamic strategy that adapts to environmental constraints.
A Unified Pipeline Synchronizing Human and Vehicle Signals
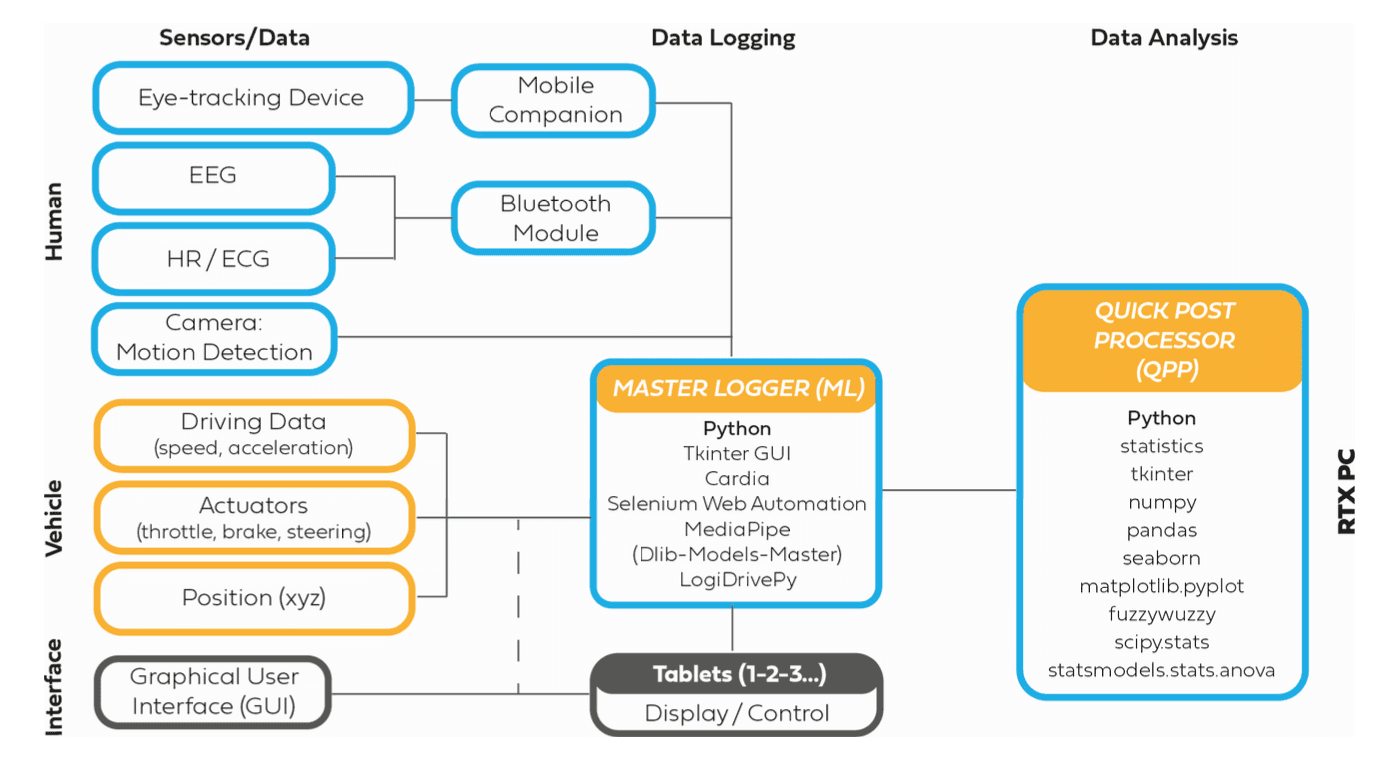
Figure 2: Diagram presenting the architecture of the ADDA system. Source: Sándor, Á. P., & Nagy, V. (2024). Automatized Driving Data Analyzer: A Synchronized and Modular Application for Data Logging and Analysis. Engineering Proceedings, 79(1), 18.
To build a more complete understanding of driver behaviour, it is essential to correlate visual attention with physical actions and physiological responses. This requires "Data Fusion", or the ability to synchronize disparate data streams into a unified timeline.
To this end, Sándor and Nagy developed a modular framework called the Automatized Driving Data Analyzer (ADDA). This system acts as a central hub, synchronizing real-time data from Neon (gaze), Polar sensors (heart rate), and vehicle simulators (BeamNG).
The ADDA framework is critical because human behavior is multimodal. It provides a managed data acquisition process and one-click data analysis. The application's design ensures that data streams from all sources are captured and continuously synchronized in real time, with each data item timestamped accurately to the millisecond. This systematic and modular design allows for the storage of raw data while systematically archiving data sets.
This robust approach is designed to help researchers analyze driving behavior under different conditions, ultimately enabling a deeper understanding of the interactions between the driver and automated driving functions. Furthermore, the modular nature of ADDA enhances scalability, customization, and maintenance, providing a foundation for studying how cognitive, visual, and physiological signals interact with vehicle automation.
The Future: Mastering the "Handoff"
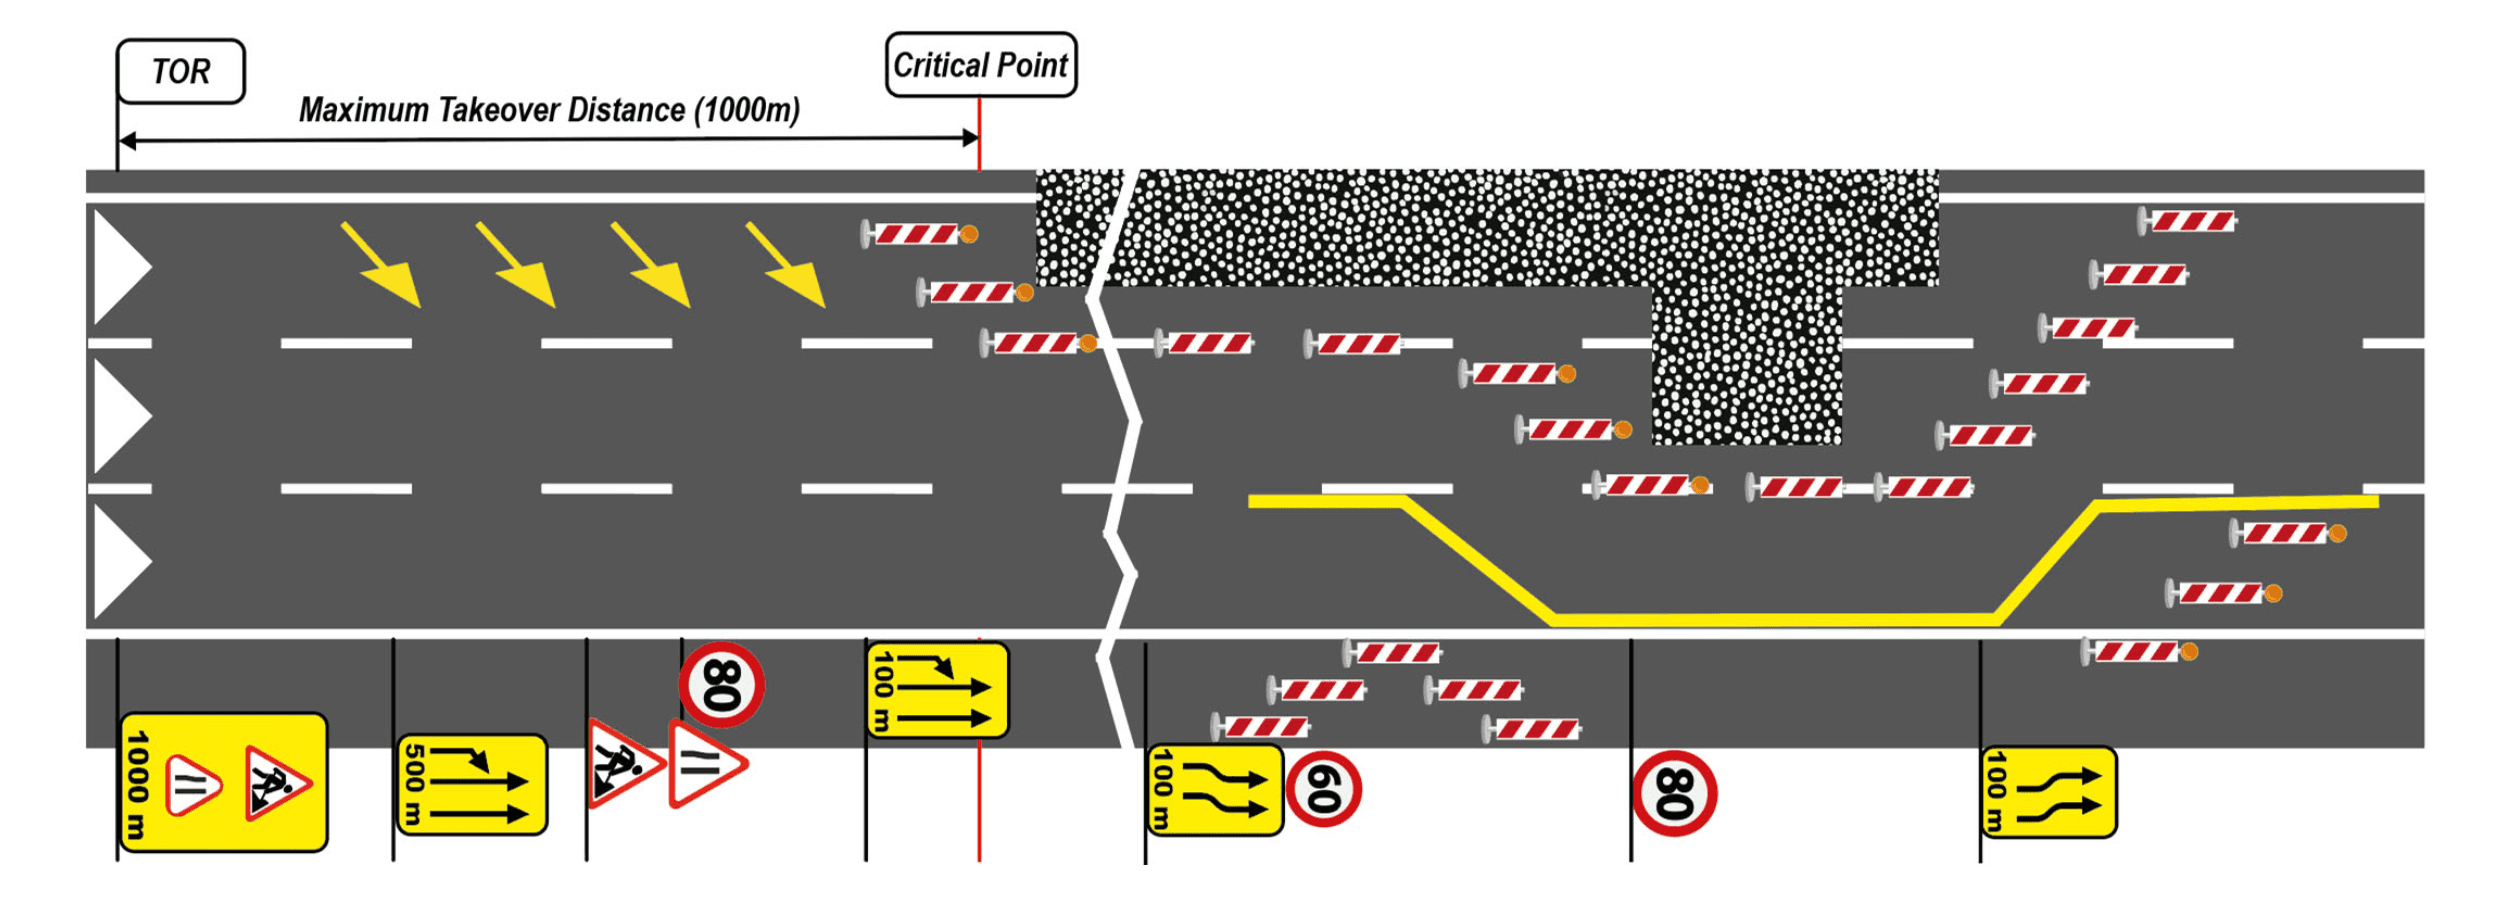
Figure 3: Road construction layout applied throughout the study. Source: Nagy, V., da Luz, D. M., Sándor, Á. P., & Borsos, A. (2024). Evaluation of Autonomous Vehicle Takeover Performance in Work-Zone Environment. Engineering Proceedings, 79(1), 59.
A critical safety challenge in cars that can drive themselves most of the time but still need a human to take over when the system reaches its limits is making sure drivers are ready to step in when the car requires it. This handoff moment is called a Takeover Request (TOR). Nagy et al. used Neon to measure how prepared drivers were during TORs in a simulated work-zone environment.
The study tracked physiological responses as drivers moved from fully automated driving to manual control:
Stress increase: Heart rate rose during TORs and manual driving, showing higher exertion.
Concentration: Blink frequency decreased when switching from automated to manual control.
Baseline engagement: Drivers maintained active gaze on waypoints even during automation, confirming continuous attention.
Heart rate and blink patterns together provide a real-time measure of driver alertness, which future automated systems could use to ensure readiness before handover.
From Sensor to Safety
Taken together, these studies illustrate that driving is as much a mental activity as a physical one. While standard sensors are excellent at tracking speed and trajectory, they remain blind to the invisible cognitive work happening behind the wheel.
By adding gaze behavior and physiological signals into the mix, this research helps bridge that gap. The data shows that a driver’s calm exterior can often hide significant mental stress, and that our visual attention naturally shifts gears to handle rain or automation handovers, often before we even touch the controls. This multi-layered approach offers a clearer picture of real-world behavior, helping researchers and others to potentially design systems that account for the human element rather than just the mechanics of the vehicle.
Extending this approach to diverse drivers and real-world scenarios could further refine automated systems and enhance road safety, providing a comprehensive framework for understanding human behavior behind the wheel.
Further Resources
Analysis of a driver's visual behaviour and its relationship with the smart road context
Full article: https://doi.org/10.1109/MN60932.2024.10615270
Research Center: Department of Engineering, University of Messina, Messina, Italy.
Weather-Dependent Variations in Driver Gaze Behavior: A Case Study in Rainy Conditions
Full article: https://arxiv.org/abs/2509.01013
Research Center: Connected & Automated Vehicles, National Research Council Canada, London, Ontario, Canada.
Automatized Driving Data Analyzer: A Synchronized and Modular Application for Data Logging and Analysis
Full article: https://doi.org/10.3390/engproc2024079018
Research Center: Széchenyi István University, Győr, Hungary.
Evaluation of Autonomous Vehicle Takeover Performance in Work-Zone Environment
Full article: https://www.mdpi.com/2673-4591/79/1/59
Research Center: Széchenyi István University, Győr, Hungary.