Research Digest
|
Human Factors Engineering
How to Measure and Map Urban Cycling Stress for Safer Streets
Urban Planning
Transportation & Mobility

Image Credit: Photo by Eduardo Enrietti. Unrelated to research, used for visualization only.
Video: Recording made with Neon during a bicycle ride (right), alongside the corresponding simulation model (left). Video courtesy of Dr. Martin Moser.
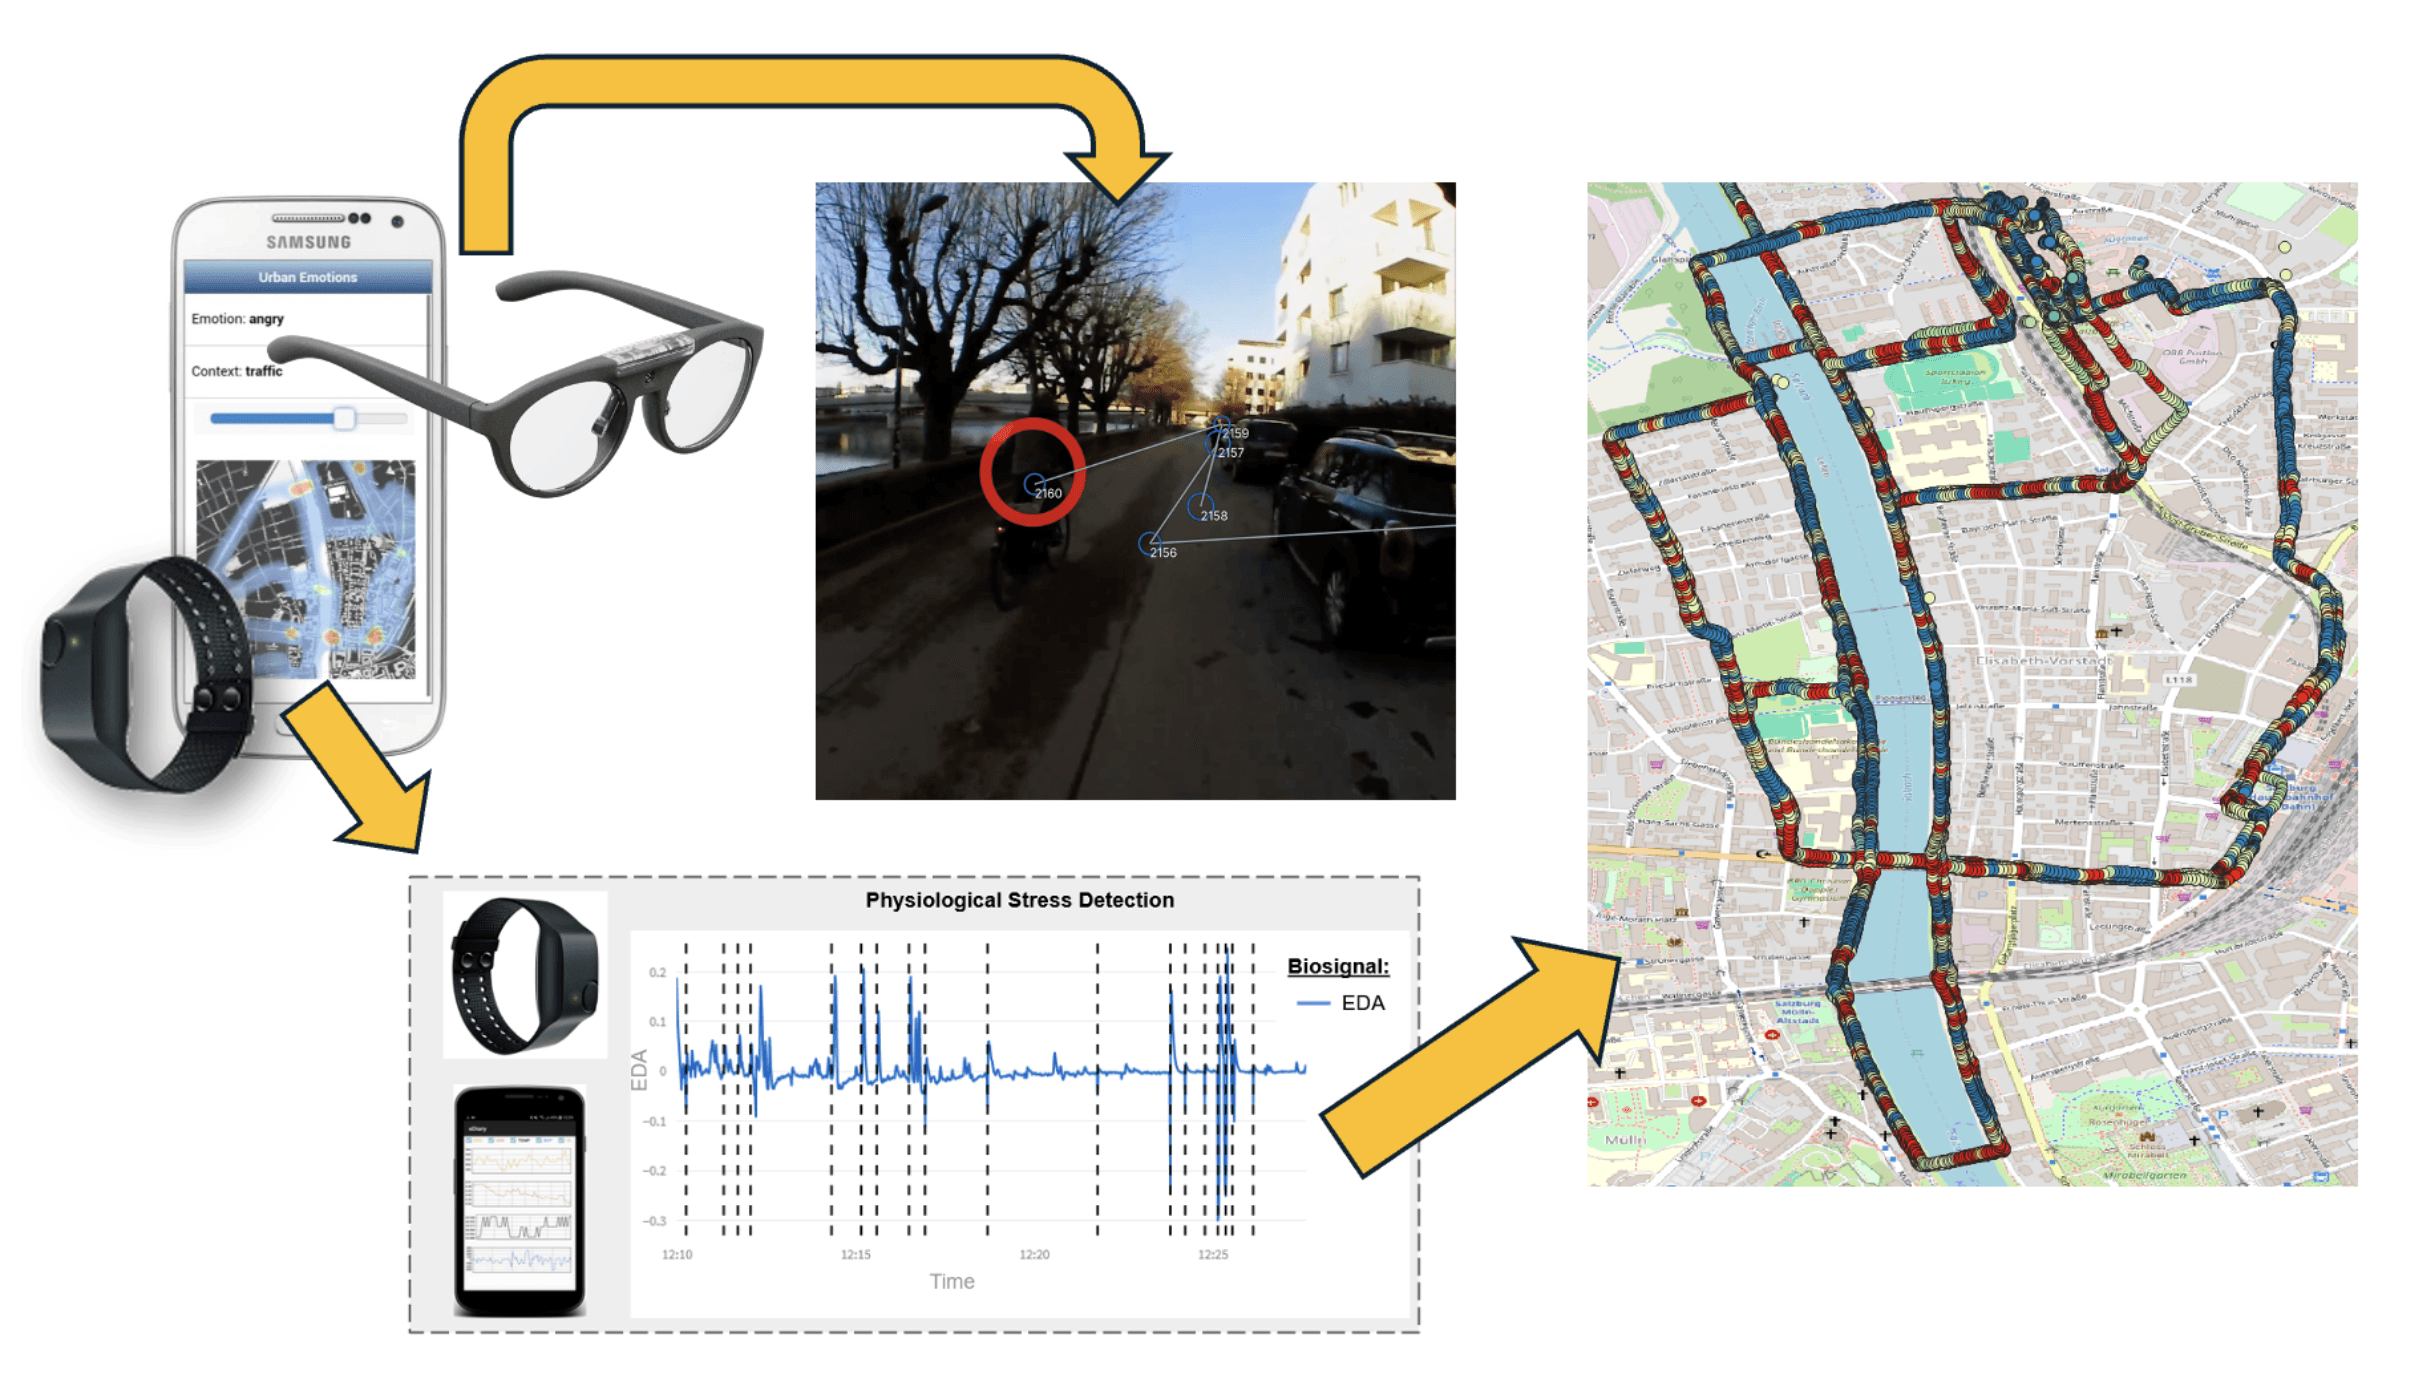
Figure 1: The multimodal sensor setup used to capture cyclists’ experiences. Source: Moser, M. K., & Keskin, M. Simulating stress in urban active mobility: A multimodal framework integrating physiological and mobile eye tracking data in cycling.
The Blind Spot in Urban Planning
Cities worldwide are shifting toward active transportation, including cycling, walking, and other human-powered mobility options, to combat climate change and congestion. However, being among the most vulnerable road users, a major barrier remains: the perception of safety. Traditionally, urban planners have relied on accident statistics and surveys to assess cycling infrastructure. While useful, these methods are reactive and only tell us where crashes happen, but not necessarily what caused the stress response, or why a cyclist felt unsafe.
To design cycling-friendly cities, we need to understand dynamic, moment-to-moment interactions between riders and their environmental surroundings. For example, how does a lack of bike lanes affect stress? How does visual attention shift at a busy intersection?
A Multimodal Approach to Measuring Stress
Martin Moser (Interdisciplinary Transformation University, IT:U) and Merve Keskin (University of Salzburg) have developed a novel framework to answer these questions. Moving beyond static surveys, their study integrates wearable eye tracking with physiological sensors to create a comprehensive picture of cyclist behavior.
The researchers conducted a pilot field study in Salzburg, Austria, equipping participants with Neon eye tracking glasses and Empatica E4 wristbands to measure electrodermal activity (a physiological indicator of acute stress). Participants navigated two distinct routes:
Easy Route: Characterized by high-quality, dedicated cycling infrastructure.
Difficult Route: A complex path with limited infrastructure and frequent road crossings.
Validating the "Stress Map"
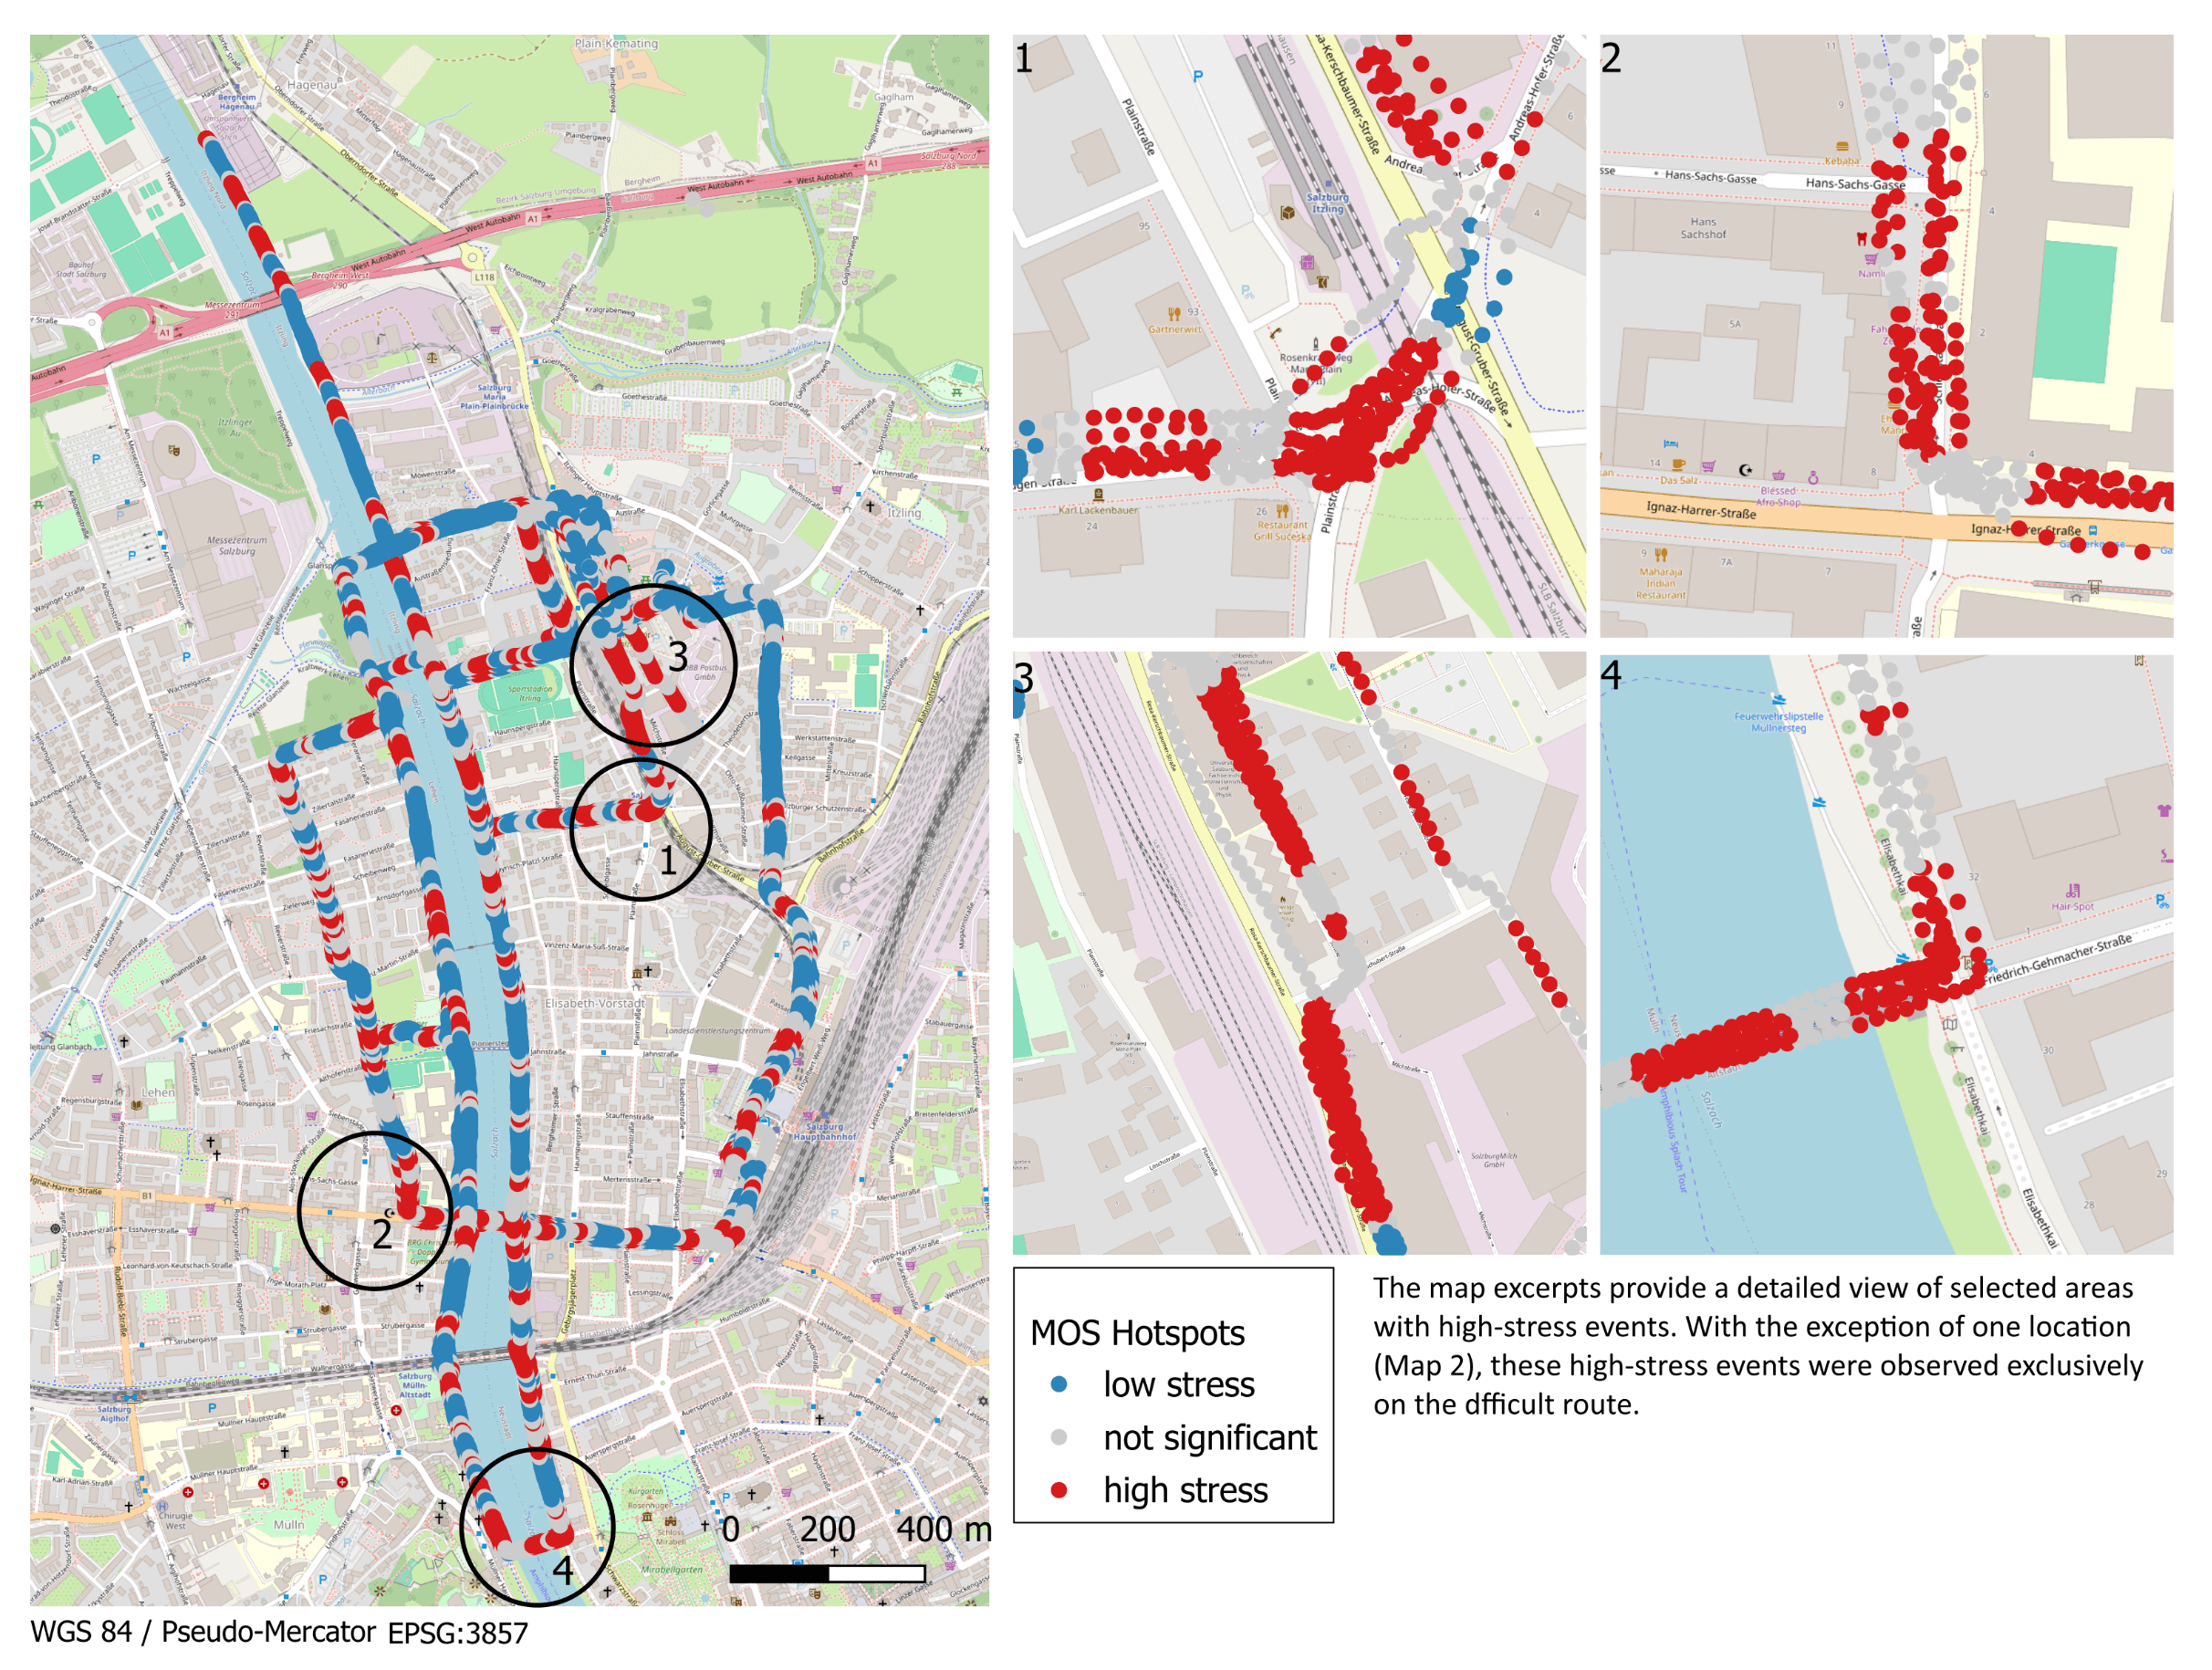
Figure 2: Spatial clusters of Moments of Stress (MOS). Hotspots appear near intersections, high traffic areas, and route segments without dedicated cycling infrastructure, while coldspots align with well-designed and protected road sections.
The results showed clear and consistent differences. The difficult route produced significantly higher physiological stress compared to the easy route. By linking these events to GPS locations, the researchers created a map of spatial stress patterns that revealed elevated stress levels near busy intersections and along segments without dedicated cycling infrastructure.
The study also revealed interesting correlations between physiology and visual behavior:
Blink Rate as a Stress Signal: Cyclists tended to blink more often during stressful moments. This pattern closely aligned with the physiological stress spikes recorded by the wristband.
The Speed Factor: Riders naturally slowed down when stress increased, likely as a way to maintain control and manage cognitive load, while maintaining alertness.
From Real-World Data to Virtual Simulation
The innovation in this work lies not only in the data collection but also in how the data is used. Moser and Keskin utilized these real-world recordings to parameterize an Agent-Based Model (ABM). By incorporating real measures of perception, stress triggers, and speed, the researchers created a virtual environment that mirrors realistic cycling behavior. This type of simulation allows planners to test infrastructure designs and evaluate potential safety improvements before implementation.
Looking Ahead: Computer Vision and Depth
Future work will expand the framework with computer vision techniques. By applying panoptic segmentation and depth estimation to the scene video captured by Neon, they aim to automatically identify exactly what objects (cars, pedestrians, signage) are triggering stress responses.
This work highlights the power of multimodal research. By combining the "where" (GPS), the "what" (Eye Tracking), and the "how it feels" (Physiological Sensors), we can move toward data-driven urban design that prioritizes not just the physical safety, but also a greater sense of comfort for every cyclist.
Further Resources
Full article
Articles – Physiological Stress Detection and Real-world Stress in cycling
An Individual-Oriented Algorithm for Stress Detection in Wearable Sensor Measurements
An Explainable Deep Learning Approach for Stress Detection in Wearable Sensor Measurements
Research Centers
Interdisciplinary Transformation University (IT:U), Linz, Austria
Geosocial Artificial Intelligence Research Group, Linz, Austria
University of Salzburg, Salzburg, Austria