Guides
What makes a good eye tracker? Part 1: Accuracy

Accuracy is often the first specification people look at when considering an eye tracker. It determines the level of detail at which gaze can be interpreted. This may mean distinguishing areas of interest in a study, identifying objects or controls in a workplace, or using gaze as an input to another system. Below, we explain what accuracy means, how it is measured, how to evaluate a manufacturer’s claims, and how much you actually need.
What is accuracy?
Accuracy describes how closely an eye tracker's reported gaze position matches where a person is actually looking. Operationally, it is the typical measurement error: the difference between measured and actual gaze location.
Accuracy is often discussed together with precision. Precision describes how much the reported gaze position varies from sample to sample during a fixation. For more on precision and how eye movements such as fixations are classified, see our What is eye tracking? article.
How is accuracy measured?
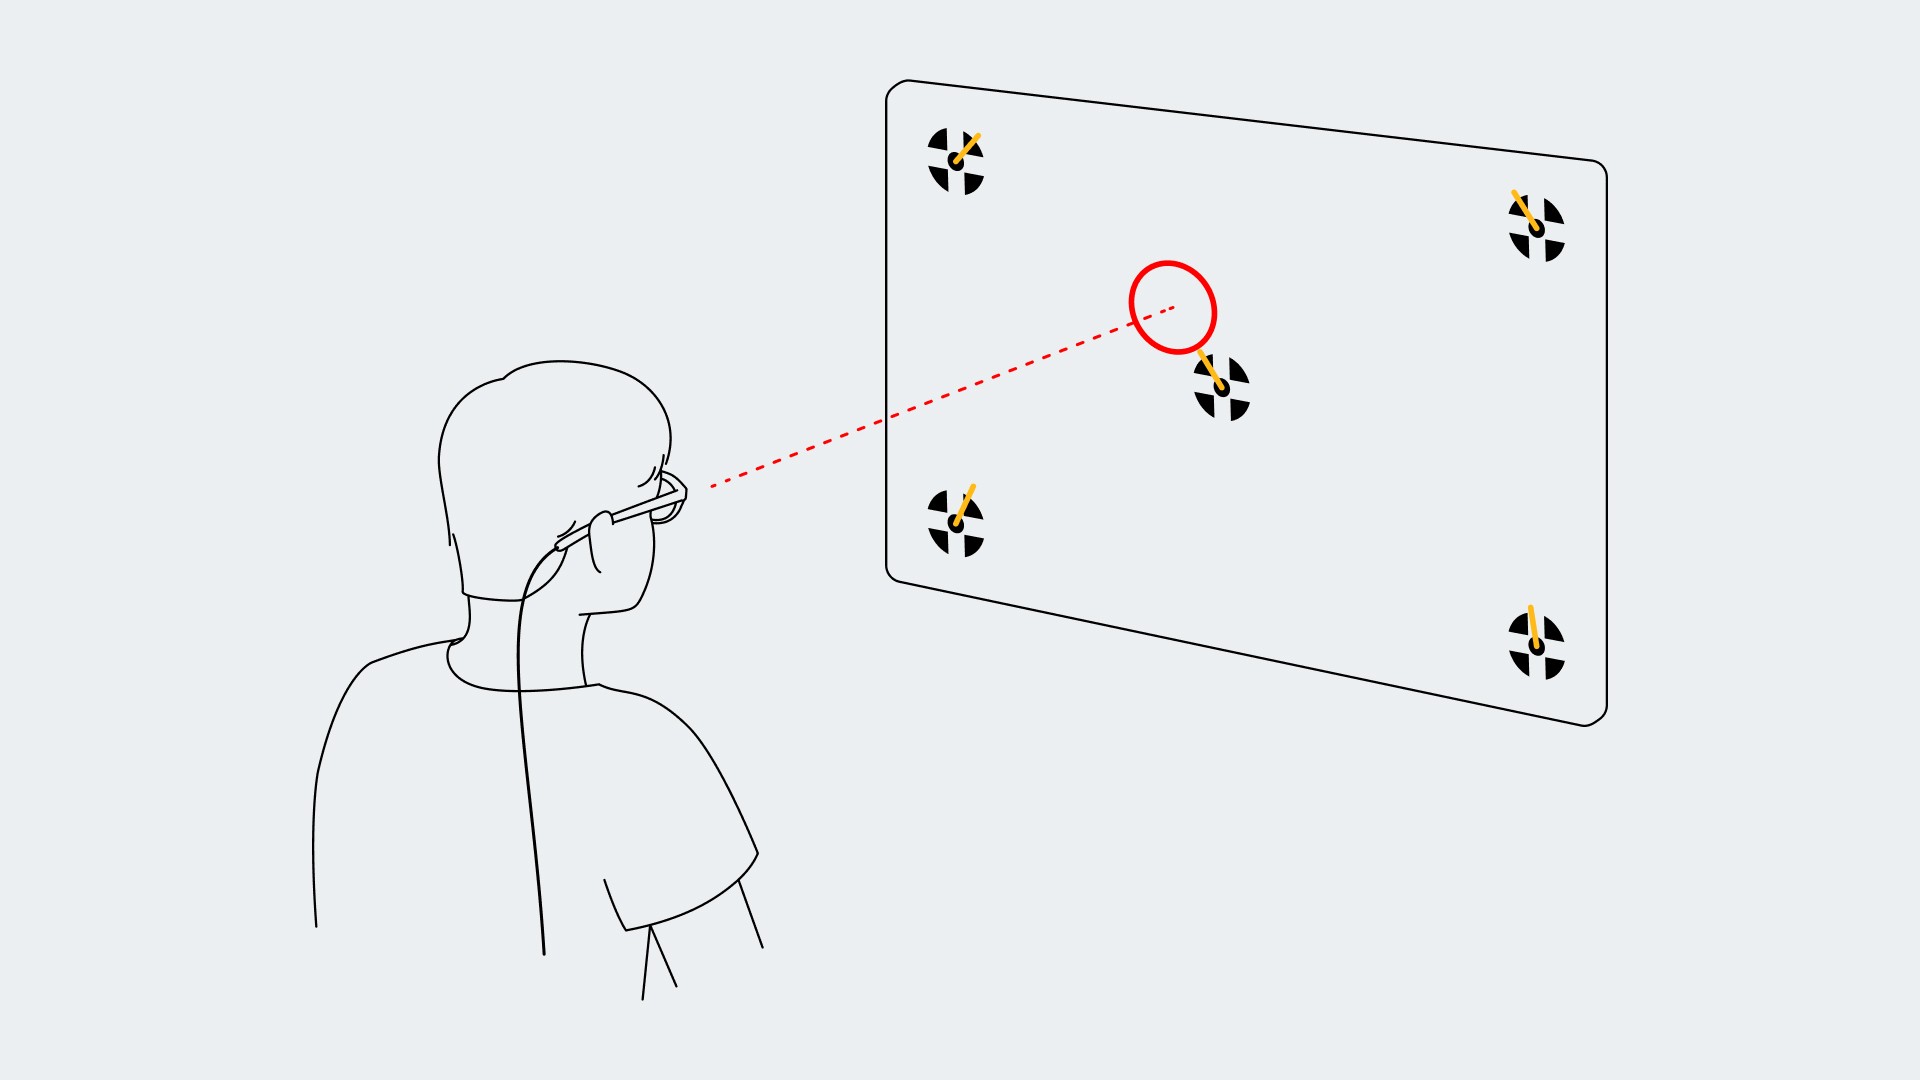
In a typical accuracy evaluation, the wearer looks at one or a series of visual targets. As they fixate each target, the eye tracker records their gaze position. For each position, the angular difference between the target's true position and the reported gaze is calculated.
Accuracy can be measured for a single wearer or for a population. A single wearer's accuracy is the typical error for that person alone. A population figure, the kind usually published in white papers and technical documents, aggregates this measurement across multiple wearers.
How to evaluate accuracy claims
Most manufacturers publish an accuracy figure in their specifications, but fewer back this up with a whitepaper detailing how it was measured. There is no single standardised procedure for measuring eye tracker accuracy, and the choices made in testing, such as who was recruited, under what conditions, and how the result was computed, can all meaningfully shift the number.
Participant inclusion is one area worth examining closely. Some evaluations exclude people wearing contact lenses or eye makeup, or whose eye shape or features are difficult for the system to handle. An accuracy figure is only as representative as the people included, so results from a narrow participant pool cannot be assumed to apply to a broader research sample or user population.
The way errors are aggregated also shapes the headline figure. An evaluation might average every sample directly or first calculate an average for each participant. It may report a mean, median, or percentile. These choices determine how individual samples and participants influence the final result, so the aggregation method should be reported.
The area of the visual field tested also matters. Accuracy can vary with gaze direction, so a result based mainly on central targets may not describe performance near the edges. The extent of the tested field and the distribution of targets within it should therefore be considered.
For eye trackers that require calibration, the timing of the measurement is critical. Accuracy is typically measured immediately after calibration, when it is newly established. This represents the best point in the session rather than performance over time, e.g. after the device has moved on the head. This is because calibrations are known to get worse over time.
It is also important to know whether the evaluation data was separate from the data used to develop or train the eye tracking system. Testing on unseen people provides stronger evidence of how the system will perform beyond the data on which it was built.
Independent third-party evaluations can be trustworthy sources, since they are conducted without manufacturer involvement. Even here, scrutiny is warranted. It is very important that they use an adequate sample and disclose their methods and conditions.
Neon's Accuracy Test Report
Neon's Accuracy Test Report provides the full methodology behind its published figures. Its controlled laboratory test included 206 participants between 18 and 85 years old, with varied contact-lens use, facial makeup, interpupillary distances, and racial appearances. Targets were distributed across a screen spanning 60° horizontally and 35° vertically. Each participant's accuracy was averaged across these target positions, so the headline result reflects performance across a broad tested area rather than only near the centre.
The average angular error was calculated for each target and then across targets to produce one accuracy figure for each participant. The headline result is the median of these per-participant figures. Neon’s final accuracy is 1.8° without calibration and 1.3° with offset correction.¹
Here are some further important points.
No data from these participants was used to train NeonNet, Neon's gaze measurement pipeline. This shows how Neon generalises to new wearers.
Neon produces accurate and reliable gaze measurements without prior calibration, so its accuracy does not depend on preserving a calibration established at the start of the recording. The Calibration-free eye tracking article explains this and the measurement approach behind NeonNet in more detail.
A separate in-the-wild evaluation extended the test to direct sunlight, deliberate changes in device position, three Neon frames, and different viewing distances. The companion article on Robustness covers those results in more detail.¹
How much accuracy do you really need?
The accuracy an application needs really depends on the research question or use case. Before deciding whether an accuracy figure is sufficient, it helps to understand its scale in the context of the human visual system.
The central fovea is the small region of the retina responsible for high-acuity vision. Detail is sharp within this region and drops off quickly outside it, which is why the eyes move to point the fovea at whatever needs to be seen clearly. It spans roughly 1.5° to 2°, closely matching the width of a thumbnail held at arm’s length. Neon’s accuracy of 1.3° is smaller than this, and falls within the span of the central fovea itself.
The fovea and thumbnail comparisons provide an intuitive sense of what 1.3° looks like, but they do not determine whether that accuracy is sufficient for a particular application. When the aim is to determine which object or area someone looked at, the relevant comparison is with the apparent size and spacing of the possible targets.
Like accuracy, apparent target size can be expressed in degrees of visual angle, and can be computed with simple trigonometry. For a target viewed straight on, its approximate angular width is:


Distance is part of the calculation because objects further away appear smaller in the visual field:
A 1 cm app icon viewed on a phone from 30 cm occupies about 1.9° of the visual field
A 15 cm cereal box viewed on a supermarket shelf from 1 m occupies about 8.6°
An 8 cm cockpit instrument viewed from a seated distance of 70 cm occupies about 6.5°

It is also true that angular size alone does not create a simple pass or fail test. Consider two items placed directly beside one another. A measured gaze point close to their shared edge may not show clearly which item the person was looking at, even when both are fairly large. If the same items are separated by a small gap, it can be much clearer which one was viewed. An isolated object with empty space around it is easier to distinguish for the same reason.
Requirements beyond gaze accuracy
Gaze accuracy is only one requirement. Research into saccades may also depend on precision, sampling rate, timestamp accuracy, and how well displacement or peak velocity is preserved. Work on vergence or eye alignment may depend on measurements from each eye independently and on the accuracy of the 3D eye state. Pupillometry may require a stable physical pupil-diameter measurement. Assistive or continuous-use systems may place particular emphasis on latency, data availability, and stability as lighting and device position change.
These examples are not exhaustive, but they show why an eye tracker should be assessed in the context of the intended measurement, operating conditions, and what the results need to demonstrate. The rest of this series looks beyond the headline accuracy figure, covering calibration-free operation, robustness, data streams, adaptability, integration, analysis, and the other qualities that determine how well an eye tracker works in practice.
Where to go next
This article is part of a series exploring what makes a good eye tracker. Related topics include:
¹ Baumann & Dierkes, Neon Accuracy Test Report, Pupil Labs, 2026. doi:10.5281/zenodo.18504792
Read the full Neon accuracy test report.
Not sure what accuracy your study needs? Email info@pupil-labs.com.