Guides
What makes a good eye tracker? Part 8: Analysis

Eye tracking analysis turns recorded measurements into information that helps answer a question. Depending on the application, that might mean understanding how someone performed an activity, comparing viewing patterns across participants, or examining how pupil diameter changes during a task. Each requires different measurements, methods, and outputs.
Pupil Labs provides analysis software for common workflows alongside access to the recorded data for specialised methods. This article explores how Pupil Cloud, Neon Player, Neon Monitor, and custom processing support different ways of working with Neon eye tracking recordings.
Reviewing and understanding an activity
For some applications, the most useful analysis is a high-level, qualitative examination of what happened. A coach might review an athlete’s gaze during a particular movement. A usability researcher might examine how someone searched for a control while listening to their explanation of what was confusing.
The useful output could be a short sequence for discussion, an observation about someone’s behaviour, or an annotated account of the activity. Numerical measures may contribute, but watching the recording can already answer important questions.
Pupil Cloud and Neon Player both support reviewing scene video alongside eye tracking data. A gaze overlay connects the wearer’s viewing direction to the scene. Measurement timelines show how signals changed during the activity, while user-added events that show up in the timeline can mark relevant moments.¹,² A researcher can then move between an overview of the session and closer inspection of a particular sequence.
Pupil Cloud provides a browser-based environment for this work. Neon Player provides a desktop environment that runs offline and keeps recordings on the local computer.¹,²
Qualitative analysis can also begin during the activity itself. Neon Monitor displays live scene video with a gaze overlay in a browser on another device connected to the same local network. A coach could follow an athlete’s gaze during a drill and mark relevant moments with events for discussion afterwards.¹
Measuring and comparing what people looked at
For other applications, it can be necessary to examine viewing behaviour with quantitative metrics and visualisations of results. Metrics might include the number of fixations on an object, the total duration of those fixations in milliseconds, or the number of gaze shifts between particular regions. Established visualisations help interpret these measurements in context.
To achieve this, gaze and fixations need to be mapped onto objects or regions of the environment, as described in the gaze-mapping article, where mapping onto a shared reference image positions fixations from different recordings at corresponding locations on the image.
From these mapped fixations, metrics can be calculated and visualisations generated.
Exploring the viewing pattern
One of the most recognisable visualisations are heatmaps. They provide an overview of where fixations were concentrated on the reference image. In Pupil Cloud, mapped fixation positions are grouped by location and smoothed into a colour map overlaid on the image. The colours represent the relative concentration of fixations, making regions with more fixations stand out as redder (hotter).³

A heatmap can show a single recording, combine several recordings from one participant, or aggregate recordings from multiple participants.³ For example, a hotter area over a promoted product would indicate that shoppers’ fixations were concentrated on that item.
This can help identify patterns for closer examination. Comparing individual recordings can show whether a concentration reflects behaviour shared by many people or repeated viewing by a few. Heatmaps generated from different product placements or packaging designs may reveal very different gaze behaviours at the individual or group level. Such visualisations are very useful and often chosen for presentations and reports since they are easy to interpret.
Gaze and/or fixation scanpaths add information about the sequence of fixations. Pupil Cloud represents fixations as circles connected in order, with circle size scaled by fixation duration. The larger the circle, the longer the fixation.⁴ This approach can add critical context. For example, two operators might produce similar heatmaps, but they may in fact have checked the instruments in different orders or returned to particular readouts repeatedly - behaviours that a heatmap alone wouldn’t have revealed.
Scanpaths from longer recordings can become crowded. Therefore, a well-defined question helps identify a useful section to visualise. Examining the first few seconds after a warning appears, for example, may reveal patterns that are difficult to follow across an entire work session, especially when you have scanpaths from multiple participants overlaid onto an image.
Defining areas of interest
Areas of interest, or AOIs, turn relevant parts of the reference image into regions for measurement. In Pupil Cloud, these can be drawn on the reference image after a mapping enrichment has been completed.⁵ Separate regions might cover instrument readouts, warning indicators, or machine controls.
Once these AOIs have been drawn onto the image, it is possible to measure the fixations that fell within each of them and compute metrics. These metrics describe different aspects of viewing.
Choosing viewing metrics
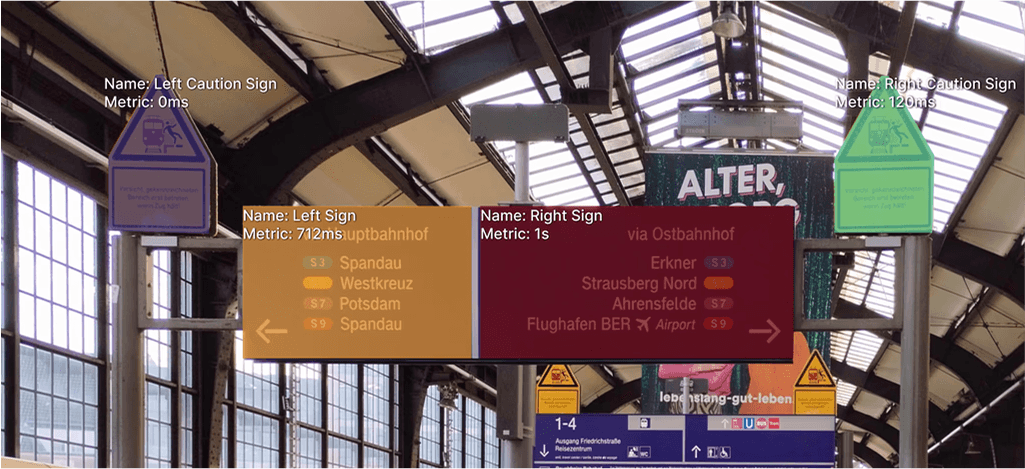
Areas of Interest and Metrics
Draw AOIs on top of the reference image or surface. Automatically generate standard metrics and heatmaps from AOI’s.
Fixation count records how many fixations fell within an area.⁵ A packaging study could compare fixations on the product name and preparation instructions to see whether a design change caused more viewing on the intended information.
Total fixation duration adds together the durations of fixations within an area.⁵ A human factors study could compare fixation time on an important status display across panel layouts to see whether a redesign changed how much it was viewed.
Time to first fixation measures the delay before an area was first fixated, relative to a defined starting point.⁵ A wayfinding study could compare sign positions by measuring the delay from entering a station concourse to first fixating a directional sign.
Reach describes the percentage of participants or recordings in which an area was fixated at least once.⁶ A retailer could use reach to assess whether most shoppers looked at a promotion at least once, or whether it was viewed by only a small minority.
Grouping AOIs with labels
Pupil Cloud allows researchers to assign labels to AOIs to group their measurements for analysis. A label can identify an individual AOI or bring several related regions together. For example, separate AOIs around warning indicators could share the label “Warnings”. Researchers could then examine their combined fixation duration to understand how much viewing time was devoted to warnings across the control panel.⁵
Visualising metrics with bar charts
Pupil Cloud’s Bar Chart visualisation lets researchers compare measurements for individual AOIs or groups of AOIs side by side. Each bar represents a label, and its height shows the value of the selected metric. Users can choose which labels and recordings to include. For example, a chart of total fixation duration could show how viewing time was divided between warnings, status displays, and controls. Separate charts using recordings from experienced and novice operators could then show whether the groups viewed the panel differently.⁶
Comparing results across enrichments
Labels also support comparisons across mapping enrichments, where recordings have been mapped onto different reference images. A team testing two control-panel layouts could label their warning AOIs “Warnings, Layout A” and “Warnings, Layout B” to compare their metrics as separate bars. Using the shared label “Warnings” would instead combine their results across the selected enrichments.⁵,⁶
Custom analysis with exported data
A research question may require measures beyond Cloud’s standard AOI metrics, or an analysis that combines viewing behaviour with other study data.
Pupil Cloud exports both the calculated metrics and the fixation data associated with each AOI as .csv files.⁵,⁶ Users can import these into their own analysis software, such as spreadsheet software, Python, or Matlab, to calculate customised measures.
For example, the mapped fixations preserve the sequence and timing of viewing. A human factors study could measure how often gaze moved between an instruction sheet and a control panel. Researchers could also calculate how long operators took to return to an instruction after checking a readout and identify which controls they inspected in between. These measures describe how operators consulted instructions and checked equipment during a task.
The exports can also be combined with other study data. Linking viewing measurements to task errors would allow a team to compare how operators inspected equipment during successful and unsuccessful attempts. Combining them with questionnaire responses could help examine whether operators who spent more time viewing instructions also recalled more of the procedure afterwards. These comparisons connect viewing behaviour to the decisions or outcomes the study is investigating.
Processing measurements for a research question
Many analyses work directly with the recorded signals. A pupillometry study might examine changes around an experimental event. An eye-movement study might characterise saccades or investigate coordination between the eyes and head.
These questions require processing methods and outcome measures chosen for the study. Access to the data, in open formats, allows researchers to use established methods, adapt an existing workflow, or develop their own.
The following examples from our Research Digests show how researchers have used Neon’s measurements to study some different topics that required working with the raw measurements.
Examining responses to driving events

Researchers at the University of Messina used Neon in a simulator to investigate responses to overtaking and forced lane changes through a work zone. They analysed pupil diameter and blink rate alongside lane position and other vehicle behaviour. During overtaking, they observed pupil contraction and increased blinking, showing how eye measurements can describe responses to manoeuvres alongside vehicle control.⁷
Using eye movements to investigate perception

Researchers at Chemnitz University of Technology tested whether gaze recordings from Neon fitted with coloured filters could identify perceived motion as accurately as established laboratory setups. Each eye saw stripes moving in opposite directions, while perception could alternate between them.⁸
The team analysed optokinetic nystagmus, a pattern of slow tracking movements followed by fast resets. They excluded blinks and fast movements to measure the direction of slow tracking, which tends to follow perceived motion. After accounting for reporting delay, this direction matched participants’ button-press reports with similar accuracy to the laboratory setups.⁸
Measuring saccade velocity during sport
Researchers at the University of Zaragoza used Neon during table tennis tasks to investigate how eye-movement patterns varied with expertise and cognitive profile. They marked task periods in Cloud, then used custom software to analyse each eye separately, extracting saccade frequency, duration, length, and velocity alongside fixation duration and pupil diameter.⁹
They compared saccade velocity distributions between groups and plotted peak velocity against movement amplitude for representative participants.⁹
Supporting the analysis a project needs
These examples illustrate how much the purpose of an analysis can vary. A good eye tracking system should make common tasks straightforward and provide access to the measurements for specialised methods. Pupil Cloud and Neon Player support reviewing recordings, visualising patterns, and comparing results. Access to Neon’s data streams lets users develop the additional measures their questions require.
Where to go next
This article is part of a series exploring what makes a good eye tracker. Related topics include:
¹ Pupil Labs, Pupil Cloud Playback and Timeline.
² Pupil Labs, Neon Player and Playback and Timeline.
³ Pupil Labs, Heatmap.
⁴ Pupil Labs, Scanpath.
⁵ Pupil Labs, Areas of Interest.
⁶ Pupil Labs, Bar Chart.
⁷ Pupil Labs, Beyond Telemetry, Decoding the Human Factor in Driving, Research Digest, 2025.
⁸ Pupil Labs, Researchers 3D-Print an Add-On for Stereoscopic Eye Tracking with Neon, Research Digest, 2026.
⁹ Guiseris-Santaflorentina, Sanchez-Cano and Orduna-Hospital, Wearable eye-tracking of visuomotor strategies in table tennis players of diverse expertise and cognitive function in a naturalistic environment, Human Movement Science, 2026; Pupil Labs, Can Eye Tracking Reveal Visual Strategies Across Table Tennis Expertise and Cognitive Profiles, Research Digest, 2026.
Explore analysis in Pupil Cloud.
Work with recordings locally in Neon Player.